Internal reporting tools should help a named group make a defined decision with information whose meaning, source and freshness can be inspected. They are not successful merely because charts render quickly or executives agree that the layout looks modern. A weekly service report, finance close pack, operational queue and regulatory submission have different grains, deadlines and evidence needs. The design must begin with the work moment and consequence, then establish which facts and calculations are trustworthy enough for that use.
This article focuses on the reporting product rather than a general data platform. It complements Edilec's guides to internal tools for operations teams, admin dashboard architecture and multi-role business applications. The core question is whether a reader can act, challenge a result and understand the correction route without assembling private spreadsheets around the official tool.
Start with the decision and cadence
Describe the meeting, workflow or trigger in which the report is used. Name the decision owner, participants, questions, deadline, tolerated delay and action that follows an exception. A daily operations queue may prioritize cases from the last hour; a monthly board report may require a closed period and commentary. Mixing both into one dashboard usually produces filters no one trusts. Document what the report must not decide as well, particularly where a human must assess context or approve a consequential action.
Specify the reporting grain. Is each row a customer, order, invoice, event, case or day? Define the population and denominator before choosing visuals. A conversion rate without eligibility rules invites argument; an average resolution time without treatment of reopened cases can reward the wrong behavior. The U.S. Government Accountability Office data reliability guide emphasizes assessing data in relation to its intended purpose. That principle is useful for every internal report: reliability is not absolute, and the decision determines the necessary assurance.
| Reporting use | Freshness and grain | Required action context |
|---|---|---|
| Live operations queue | Minutes; one work item | Owner, priority, state and next safe action |
| Weekly team review | Daily; team or workflow | Trend, exceptions and improvement owner |
| Monthly finance close | Closed period; account or entity | Reconciliation, adjustment and sign-off |
| Customer service review | Agreed period; service and customer | SLA definition, exclusions and incident notes |
| Compliance report | Controlled period; evidence item | Scope, provenance, reviewer and submission status |
| Executive portfolio | Monthly or quarterly; product | Comparable definitions, confidence and decision request |
Write metric contracts before dashboards
Each consequential metric needs a plain-language definition, formula, grain, dimensions, source authority, owner, freshness, treatment of late and corrected records, and version history. Include examples that should and should not count. If teams need variants, name them rather than silently changing a shared metric with filters. A semantic layer can centralize calculations, but governance remains a human decision about meaning. The dbt Semantic Layer is one implementation example of defining and querying governed metrics across tools.
Definitions should be discoverable from the report. A reader needs the current meaning, data timestamp and owner without leaving the decision. Keep technical lineage available for analysts and operators, while presenting concise business context to most users. Version material definition changes and annotate historical comparisons. Recomputing the past under a new rule can be valid, but users must know whether a trend reflects operational change, data correction or definition change.
Model authoritative data and history
Map each input to its authoritative system and explain how records are joined. Durable keys, effective dates and conformed dimensions prevent common reporting errors. Microsoft guidance on star schema distinguishes fact and dimension tables and explains why consistent grain matters for analytical models. The pattern is useful when it makes business events and descriptive context explicit; it should not be applied mechanically to hide unresolved ownership or duplicate facts.
Preserve enough history to reproduce reported periods. Slowly changing attributes, late-arriving events, deletions and merged identities need deliberate treatment. Link outputs to input versions and transformation activity where feasible. W3C PROV provides a general model for relating data entities, producing activities and responsible agents. Reporting tools do not need to expose that vocabulary to every user, but they should retain a chain that supports investigation when a number is challenged.
- Define durable identifiers and join rules for every report population.
- Separate event time, processing time and reporting-period close.
- Record late-data and restatement policy for material metrics.
- Keep dimensions and code lists versioned with business meaning.
- Mark estimated, incomplete or stale results visibly.
- Retain the transformation and source version needed to reproduce important outputs.
Test reliability at the decision boundary
Tests should reflect the metric contract and business consequence. Schema, null, uniqueness and relationship checks catch structural defects; reconciliation catches missing or duplicated totals; distribution and freshness checks identify unusual movement; sample record review confirms meaning. dbt data tests show how assertions can be attached to models. Avoid treating a green pipeline as proof that a report is correct: transformations can faithfully produce the wrong business definition.
Decide what happens on failure. A report may block publication, retain the last good period with a stale label, publish a partial result with a warning, or route to review. The choice depends on use. Never silently substitute missing data with zero when zero has business meaning. Send alerts to owners who can resolve the cause, and tell readers which decisions are affected. Track recurring failures and manual corrections because they reveal brittle upstream processes and hidden spreadsheet dependencies.
| Quality condition | Control | Reader-facing behavior |
|---|---|---|
| Source late | Freshness threshold and owner alert | Show last successful update and affected scope |
| Duplicate records | Key and reconciliation test | Hold impacted aggregate |
| Definition changed | Version and approval | Annotate comparison boundary |
| Partial population | Coverage calculation | Display completeness and excluded groups |
| Unexpected movement | Distribution check and review | Flag anomaly without inventing explanation |
| Restatement | Controlled rerun and sign-off | Publish correction note and affected periods |
Design access, exports and commentary
Report access must follow data sensitivity and business role. Apply row, tenant and field restrictions in the serving layer, not only in the interface. Test direct links, exports, scheduled email and embedded views. Administrators need a governed way to grant and review access. Exports create durable copies outside normal controls, so define who can export, what is redacted, how files are protected and when they expire. A useful report should not require broad raw-data access merely to investigate a result.
Commentary can carry essential context, especially for close packs and service reviews. Treat comments as records with author, period, edit history and visibility. Separate explanation from data correction: an annotation may explain an incident, while a corrected figure must follow the metric and source process. Avoid free-text notes that expose sensitive personal or security information to a wider report audience. Provide links to the controlled case or incident where detailed evidence belongs.
Build a correction and sign-off workflow
When a reader challenges a number, the tool should capture report, period, filter state, metric version, underlying record and reason. Route the issue to the metric or source owner, preserve discussion, and distinguish explanation, source correction, transformation defect and definition change. Recompute affected outputs through the normal pipeline. Do not let users patch a displayed aggregate without a durable source. Publish correction status and notify audiences who relied on the earlier result.
Formal reports may require preparer and reviewer roles, evidence attachments, period locking and sign-off. Keep segregation proportionate to consequence. The reviewer needs the changes since the previous version, unresolved quality issues and evidence for adjustments, not a generic approval button. Reopening a signed period should require a reason and produce a new version. Connect reporting approval to Edilec's approval workflow software guide when the process carries financial, regulatory or customer commitments.
Review the reporting decision matrix
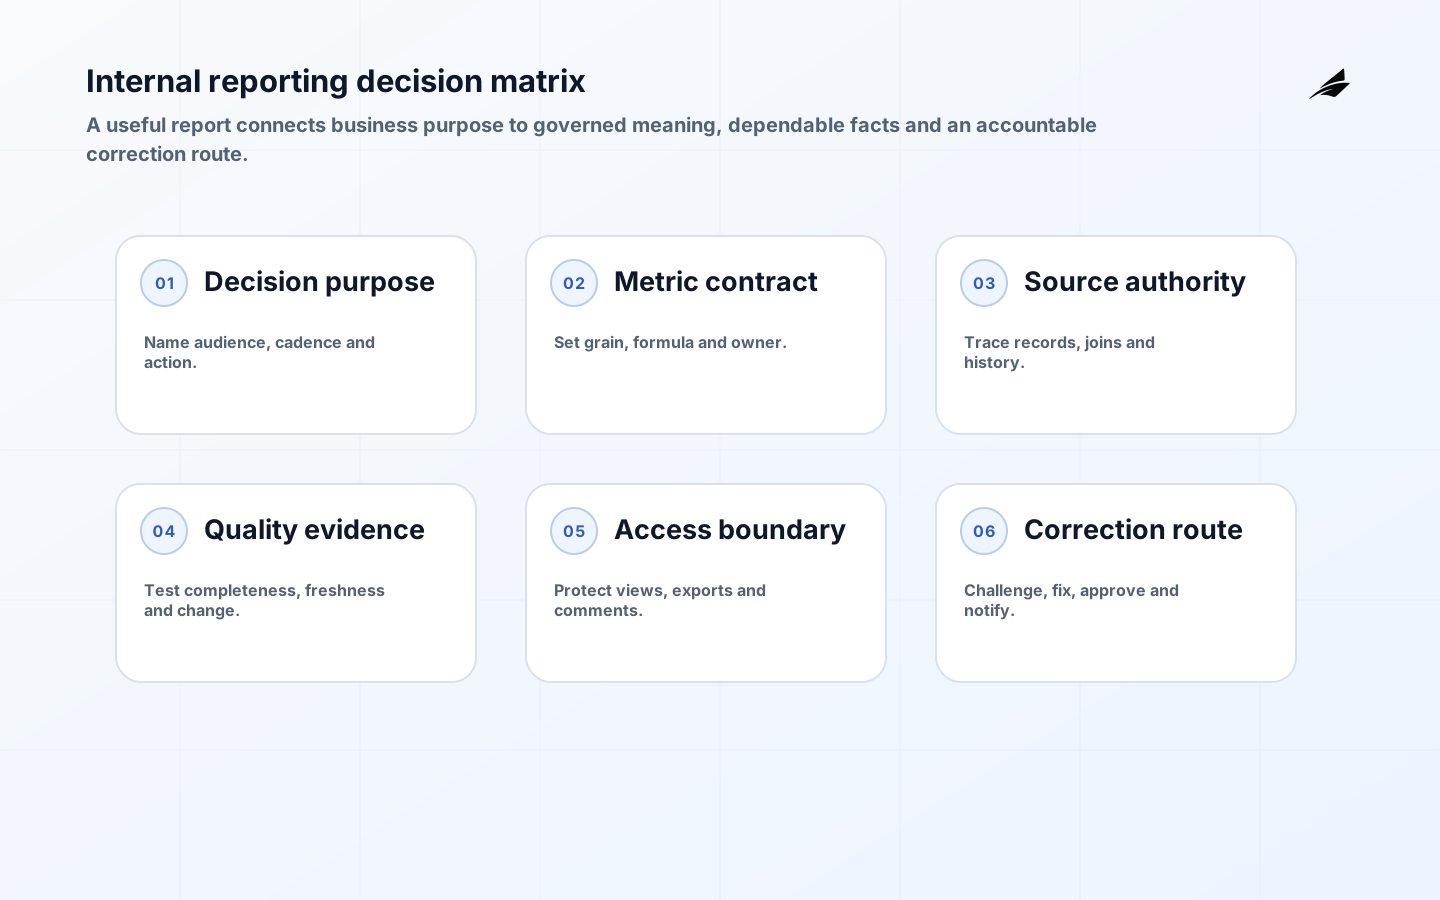
The matrix below makes six dimensions visible together: decision purpose, metric contract, source authority, quality evidence, access boundary and correction workflow. A report is ready only when each dimension supports the intended use. This prevents visual polish from masking weak definitions or unresolved ownership. Review one consequential metric through all six cells before scaling the design to an entire catalogue.

Operate reporting as a product
Measure adoption by decision value, not page views alone. Track whether intended meetings and workflows use the report, time spent reconciling outside it, challenged metrics, freshness breaches, correction duration, unused content and access-review results. Retire reports whose decision has disappeared. Consolidate overlapping metrics only after owners agree on definitions. A catalogue of hundreds of dashboards is not evidence of analytical maturity if users still export them into private workbooks to make the real decision.
Key takeaways
- Design each reporting tool for a named decision, audience, grain and cadence.
- Govern metric meaning, source authority and change history before visual design.
- Test business definitions and reconciliation as well as pipeline structure.
- Make freshness, incompleteness and restatements visible to readers.
- Apply access rules to views, exports and scheduled distribution.
- Provide a controlled challenge, correction and sign-off route.
Frequently asked questions
Should we build or buy the reporting interface?
Use a BI platform when standard exploration and governed models meet the need. Build custom workflow when the report must combine decisions, approvals, case actions or specialized access. The definition and source governance are required either way.
Can a dashboard be a source of truth?
It can be the trusted publication point for governed metrics, but the underlying operational facts and transformations still need named authorities. Trust comes from the contract and evidence, not from the dashboard label.
Do internal reports need real-time data?
Only when the decision requires it. Faster data increases cost and operational complexity. Define the decision horizon and show freshness; many planning reports are better served by stable, reconciled periods than constantly changing totals.
Conclusion
Strong internal reporting tools make a business decision inspectable. They connect a clear metric contract to authoritative facts, tested transformations, appropriate access and a controlled correction process. Begin with one consequential report, agree its grain and owner, prove it against representative records, and observe how people use and challenge it. That work produces trust more reliably than adding charts to an unresolved data model.