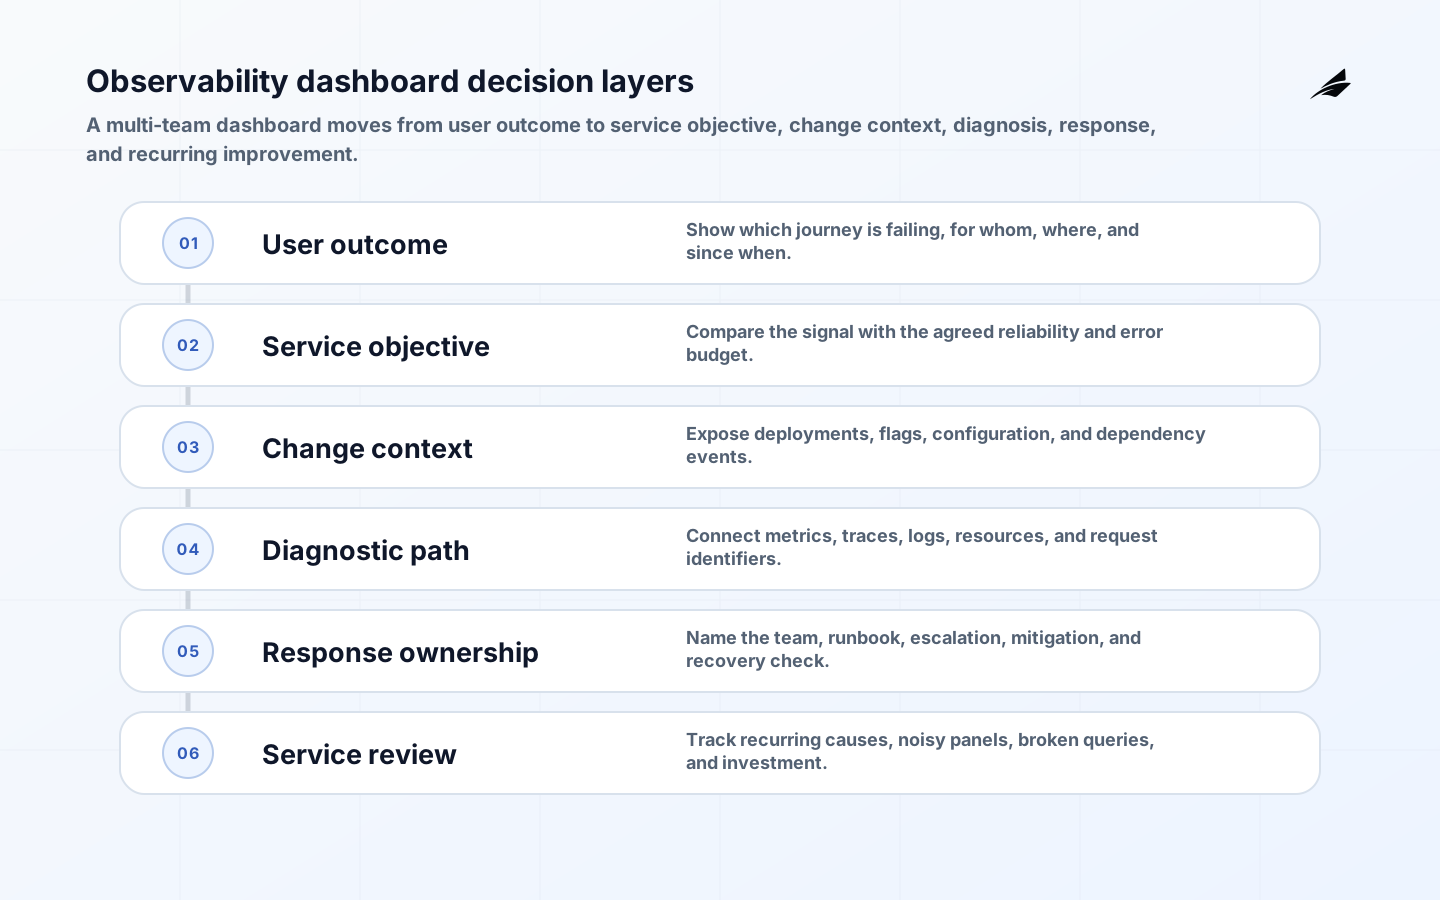
Observability dashboards are most useful when they give a named team a safer, clearer way to make a recurring production decision. Observability dashboards should help an owner decide what to do next. In multi-team delivery, a single crowded board rarely does that: product needs customer outcomes, service teams need symptoms and dependencies, and platform teams need shared-capacity and delivery signals. This checklist starts from the service and its failure consequences, then turns that context into a bounded design, an operating test, and evidence for the next decision.
Design navigation and governance across team boundaries
A multi-team dashboard should have an explicit audience and a next decision. Start with a service or user journey overview, then provide stable links to diagnostic views by dependency, region, tenant class, release, and request. Preserve consistent names, units, time windows, and filters so a handoff does not require responders to reinterpret the same signal. The OpenTelemetry signals guidance distinguishes traces, metrics, logs, and baggage; a dashboard should connect these signals through shared service and request context rather than copy every signal into one crowded screen. Keep security-sensitive fields out of labels and links because telemetry often reaches broader audiences than application records.
| Dashboard layer | Primary audience | Decision supported |
|---|---|---|
| User journey | Product, support, and incident command | Is a customer outcome failing, and for whom? |
| Service objective | Service owner and operations | Is reliability within the agreed operating range? |
| Change view | Release and platform teams | Did a deployment, flag, or dependency change the signal? |
| Diagnostic view | Responding engineers | Which request path, resource, or dependency explains the symptom? |
| Review view | Service owner and leadership | What recurring condition deserves product or engineering investment? |
Treat dashboards as maintained operational assets. Store definitions in version control where the platform allows it, name an owner, link the service objective and runbook, and record why each panel exists. Review panels after incidents and major architecture changes, but also on a fixed cadence. Remove panels that no longer affect a decision, repair broken queries, and identify teams that have silently created conflicting definitions. The Google SRE Workbook’s SLO guidance is useful because it connects measurement to stakeholder expectations and an error budget. A dashboard earns space when it helps someone decide whether to continue, investigate, mitigate, or change the service.
Use the dashboard checklist alongside Cloud Monitoring and Alerting: How to Build an Actionable Operating Signal, Observability Dashboards: A Decision Surface for Reliable Services, and Observability Dashboards: An Operations Guide.
Key takeaways
- Start observability dashboards with a specific customer or business outcome and an accountable owner.
- Define the operational boundary before selecting tools, environments, or automation.
- Treat access, change history, and recovery evidence as part of the design, not audit paperwork added later.
- Run a realistic pilot with the people who will operate the service under pressure.
- Use results to improve a supported path instead of standardizing untested local practice.
What observability dashboards needs to solve
A chart without an owner, time window, or response action turns every incident into a hunt for context. Conversely, a collection of low-level metrics can hide the fact that a customer journey is failing while infrastructure looks normal.
| Decision area | Checklist question | Evidence that makes it real |
|---|---|---|
| Business outcome | Which customer action or control depends on observability dashboards? | A named service owner agrees on what healthy and harmful look like. |
| Operating boundary | What is included in the first observability dashboards implementation, and what is deliberately excluded? | Dependencies, data, identities, and exceptions are recorded. |
| Decision authority | Who can approve, pause, contain, and validate a material change? | Roles and escalation routes are usable outside normal office hours. |
| Recovery proof | How will the team know the business outcome is restored? | A rehearsal reaches customer or record validation, not only a green technical check. |
Set the first operating boundary
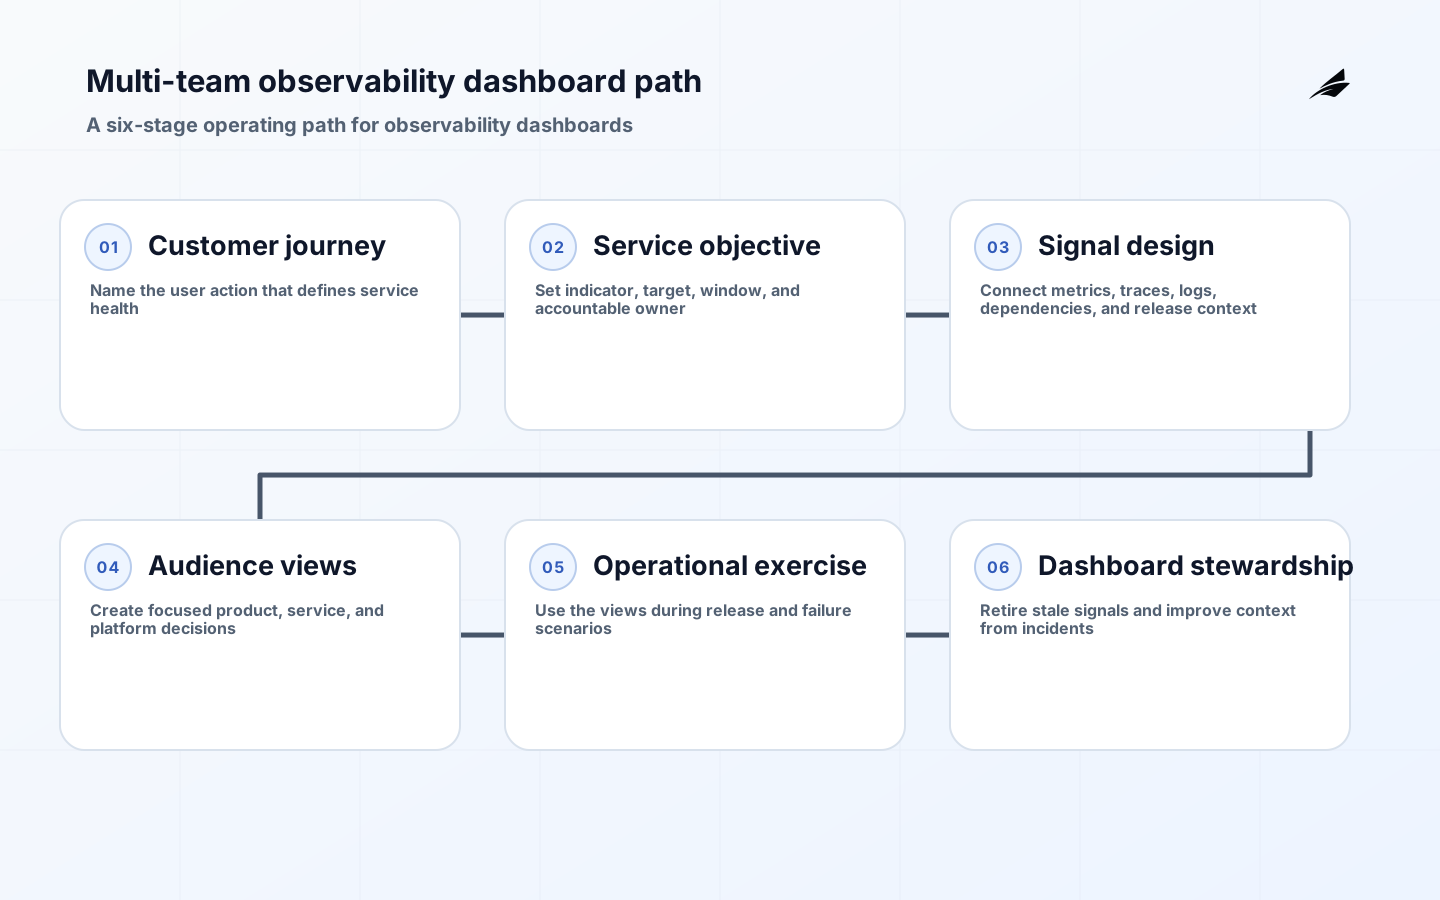
Do not begin observability dashboards as an organization-wide replacement program. Start with one critical journey and its service objective. Define the small set of views needed by the product owner, on-call responder, and platform owner, then link them through consistent service names, time ranges, and release annotations. Write down the assumptions that would invalidate the choice, including volume, availability, data handling, dependency behavior, and skills. This keeps the first implementation reviewable and prevents a useful control from becoming an open-ended platform promise.
Make the boundary usable by writing a short decision record. It should say why this scope was selected, which alternatives were considered, what evidence is still missing, and the date or event that will trigger reconsideration. For observability dashboards, a decision record is most valuable when it exposes a trade-off before it becomes an incident: a service may accept slower change in return for stronger evidence, or accept a narrower pilot in return for a faster learning cycle. The record should also identify the owner who can accept that trade-off; technical feasibility alone does not settle a customer or control consequence.
Design the observability dashboards operating path
Build from a service-level indicator to supporting metrics, traces, logs, and dependency context. State the question each view answers, the source and freshness of its data, and the person who maintains it. Use dashboard permissions that respect sensitive tenant, security, and operational data.
| Design element | Practical decision | Failure to prevent |
|---|---|---|
| Ownership | Name the service, platform, product, and control owners that have a decision to make. | A material issue waits while teams debate responsibility. |
| Change evidence | Keep the intent, reviewed revision, validation result, and exception decision together. | A responder cannot explain what changed or restore a known state. |
| Health evidence | Use customer and service signals with a stated observation window. | A technical success masks a damaged workflow. |
| Recovery boundary | State what can be reversed, what must be reconciled, and who confirms completion. | Traffic recovers while records, access, or downstream work remain wrong. |
Put observability dashboards controls in the normal workflow
Version dashboard definitions where possible, review access to sensitive fields, annotate material releases and incidents, and prevent alerts from being derived blindly from a visual. A dashboard can inform a page, but paging requires an actionable threshold and route.
Design an exception path alongside the ordinary observability dashboards workflow. An exception request should identify the operational reason, the temporary control, the approving authority, the expiry date, and the work needed to return to the supported path. This is more useful than an informal emergency channel because it preserves speed while making accumulated risk visible. When the same exception recurs, ask whether the standard is too narrow, the service has an unaddressed dependency, or the team needs a distinct operating model. Do not normalize a workaround merely because it is familiar.
- Give routine work a documented self-service path and make exceptions visible to the owner of observability dashboards.
- Use scoped identity and short-lived access wherever the underlying platform supports it.
- Record meaningful approvals, overrides, and production changes with enough context for a later review.
- Keep a current runbook that names the signal, first action, escalation route, and business validation step.
- Review recurring friction as a design problem before adding another manual gate.
Pilot observability dashboards under realistic conditions
Use the dashboard during a real release rehearsal and a controlled failure. Ask a product representative whether the journey evidence is clear, then ask an on-call responder to locate the affected service and dependency without relying on a private query.
| Pilot question | How to exercise it | Decision enabled |
|---|---|---|
| Can the service be operated? | Have the nominated owners use the normal path without private administrator help. | Clarify ownership or reduce complexity before wider use. |
| Can a harmful change be contained? | Introduce a bounded failure or rejected condition and follow the stated response. | Improve stop conditions, access, or automation. |
| Can recovery be proven? | Restore the needed state and verify the actual customer or business workflow. | Accept the recovery objective or redesign the path. |
| Can the evidence be explained? | Ask a reviewer to reconstruct the decision from retained records and telemetry. | Fix gaps in traceability, monitoring, or documentation. |
Measure whether observability dashboards supports better decisions
Track time to recognize customer impact, time to identify the owning service, dashboard usage during incidents, stale or broken data sources, alert-to-dashboard usefulness, and repeated manual queries. Retire views that no longer support a decision.
Set a review cadence that matches the rate and consequence of change. During an initial rollout, review evidence after meaningful releases, exercises, or exceptions while details are still available. Once the path is stable, use a regular service review to inspect trends, decisions that were deferred, and controls that no longer match the work. Keep the review small and action-oriented: each material signal should end with an owner, a due date where appropriate, or a recorded decision to accept the current risk. This turns observability dashboards into an operating practice rather than a checklist completed once and forgotten.
Frequently asked questions about observability dashboards
How many metrics belong on an operational dashboard?
Only enough to answer its named decision. Start with the service objective and a small set of supporting signals; provide links to deeper views instead of putting every available metric on the first screen.
Should product and engineering share one dashboard?
They can share a service-health overview, but their decisions differ. Build connected views with common definitions rather than forcing one dense layout on every audience.
Keep observability dashboards current after the first rollout
The first accepted implementation is a baseline, not a permanent answer. Revisit observability dashboards when the service gains a new customer journey, regulated data class, region, integration, runtime, or dependency that changes the original assumptions. The review should begin with the evidence already collected: what operators had to do manually, which alerts did not lead to action, which approvals delayed an urgent decision, and whether recovery produced the intended business outcome. Update the owned service record, runbook, templates, and training materials together so that the documented path remains the path people can use. Where a change creates a new risk, repeat a focused exercise rather than relying on an old successful test. Confirm that replacement owners can perform the required actions and find the same evidence without oral handover. This maintenance work is deliberately modest: it preserves the value of observability dashboards by making operational knowledge durable as teams, systems, and responsibilities change.
Conclusion
Useful observability dashboards are decision surfaces with ownership, context, and a direct route to investigation. Anchor them in customer journeys, test them during real operational work, and keep the signal set intentionally small.