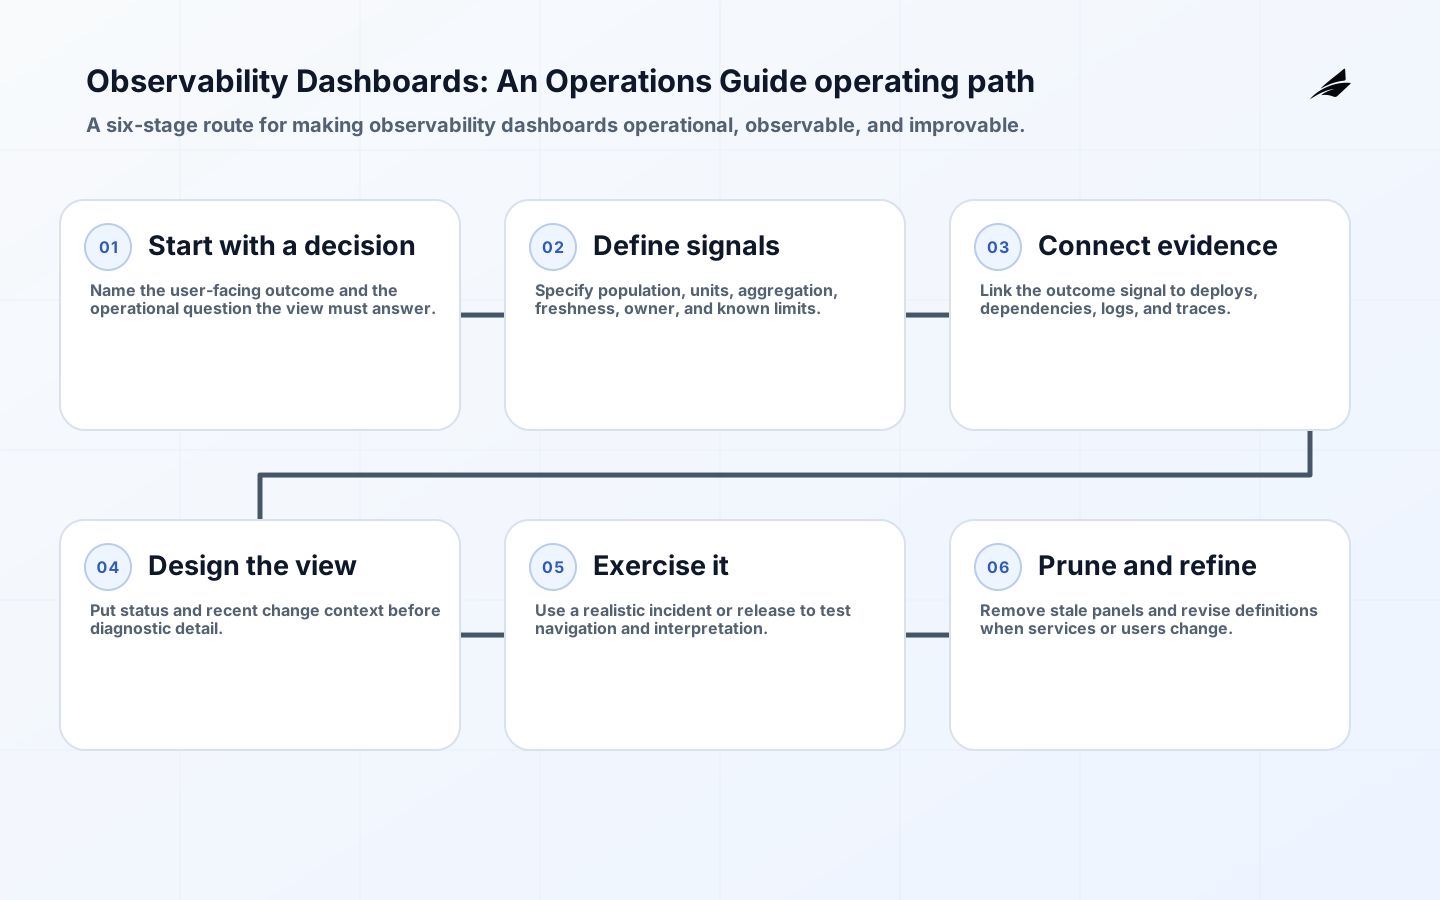
Observability dashboards are valuable when they make a difficult operational decision easier to take repeatedly, not when they merely add another tool or approval. For IT managers and service owners, the useful boundary is the dashboards, service-level indicators, log and trace links, ownership labels, and refresh rules used to understand production behavior. Start by naming the outcome the practice protects, the people affected when it fails, and the person with authority to accept or stop a change. That definition prevents a familiar problem: a capable technical implementation with no shared rule for deciding what is safe enough to proceed. A checkout overview should make the customer-facing success rate visible first, then offer links to latency, dependency, deployment, and trace evidence for diagnosis. The guide below treats that trace as the product of the work. It helps a new operator understand what happened, helps a reviewer challenge an unsafe assumption, and gives a team a way to improve after an ordinary change or a stressful failure.
Planning observability dashboards before implementation means being precise about the decision rather than pretending uncertainty can be automated away. The team should agree what a responder should look at first, which questions a dashboard can answer, and when a human must investigate beyond the chart. Write those answers in language a product owner, engineer, and support lead can each test against a real case. The records that make the decision reviewable are service objectives, metric definitions, dashboard versions, alert links, trace or log queries, and the owner for each panel. A short, maintained decision record is more useful than a comprehensive catalogue that is out of date by the next release. Keep the first scope small enough to exercise with live work, including an incomplete request, a changed dependency, and an urgent exception. Those cases reveal whether the operating rule survives pressure.
Define the boundary and decision rights
Treat the boundary for observability dashboards as a contract. It should state what enters the workflow, what evidence is required, which system is authoritative, and what leaves it when work is complete. The named owner does not have to perform every task, but must be able to resolve a conflict between speed, customer impact, cost, and safety. Capture the normal path and one adverse path. For example, ask what happens when a dependency changes after review, when an approver is unavailable, or when production evidence disagrees with a test. The key failure modes are a wall of charts with no decision context, metrics that disagree because their populations differ, and panels that nobody maintains after a service changes. Each is a design prompt: make the next responsible action, the expiry of an exception, and the evidence location visible before the situation becomes urgent.
| Decision question | Practical answer for this guide | Evidence to retain |
|---|---|---|
| What is in scope | the dashboards, service-level indicators, log and trace links, ownership labels, and refresh rules used to understand production behavior | An approved boundary and named owner |
| Who can decide | what a responder should look at first, which questions a dashboard can answer, and when a human must investigate beyond the chart | Role, escalation route, and time limit |
| Which records matter | service objectives, metric definitions, dashboard versions, alert links, trace or log queries, and the owner for each panel | Stable identifiers, versions, and timestamps |
| What requires a pause | a wall of charts with no decision context, metrics that disagree because their populations differ, and panels that nobody maintains after a service changes | Exception record and a safe fallback |
Build an operating model people can use
The operating model for observability dashboards should fit the way work actually moves across teams. Define a trigger, a minimum evidence set, a reviewer or automation, and a result that can be independently checked. Do not turn every step into a gate: reserve human review for decisions with material consequence or context that cannot be captured safely. Make routine, low-risk work constrained by defaults and policy; make exceptions explicit, attributable, and time-bounded. A strong model also says who supports the workflow outside office hours and who owns its maintenance. A dashboard becomes noise when it answers every possible question slowly and the urgent question not at all. The aim is an understandable system that an on-call engineer, delivery lead, or new team member can operate without reading a private chat thread.

Use representative tests to establish whether observability dashboards are real in operation. Exercise a simulated latency regression, a dependency failure, a recent deployment, and a user report that requires moving from a symptom to a likely cause. During each test, have the operator explain not only the action but the evidence that justifies it and the signal that would tell them to stop. This exposes hidden dependencies, permissions that are too broad, and runbooks that assume knowledge only one person has. Preserve the test result with enough context to reproduce the decision later: the version, scope, actor or service identity, outcome, and any accepted limitation. Tests are not paperwork. They are the cheapest way to discover whether the workflow remains legible when the happy path ends.
| Operating moment | Owner action | Review question |
|---|---|---|
| A routine change arrives | Apply the defined path and record the resulting state. | Did the evidence meet the stated threshold? |
| A required input is missing | Pause, route, or use the documented fallback. | Was the exception visible to the right owner? |
| A material signal worsens | Contain impact and assess the affected boundary. | Can the team explain the user consequence? |
| The design changes | Retest the affected rule and update the decision record. | Which assumptions and records are now stale? |
Measure observability dashboards by the quality of decisions and recovery, not only by throughput. Useful signals include dashboard load time, panel freshness, alert investigation time, missing telemetry, abandoned panels, and repeated requests for manual data pulls. Establish a baseline before changing the process, then review the numbers alongside a small sample of real cases. A tidy percentage can conceal a responder who cannot find the right information, an exception that has silently become permanent, or a monitoring rule that produces noise instead of action. Choose a cadence that matches the rate and consequence of change. Release-critical controls may need every-change review; stable operational practices may suit a monthly check with a deeper review after a material incident or architecture change.
Implement in small, testable stages
A durable rollout for observability dashboards begins with one workflow that has a willing owner, realistic volume, and consequences the team can explain. Publish the exit condition for each stage before work begins. The first goal is not broad adoption; it is proof that the responsible people can follow the path, detect a problem, and restore a safe state. Train the people who receive exceptions or support requests before enabling the new route. Expansion should preserve the original evidence while rechecking assumptions for every new service, account, customer segment, or dependency. Similar-looking work often differs in data sensitivity, recovery options, ownership, and contractual obligation.
The most useful implementation question is: what would make this decision unsafe tomorrow? For observability dashboards, that question directs attention to configuration drift, unowned dependencies, stale assumptions, access changes, and delayed signals. Design the workflow so these conditions create visible work for a named person rather than an invisible risk. Pick one service objective and create the smallest dashboard that lets an on-call engineer detect, scope, and investigate its breach. When the initial path is stable, use findings to simplify it. Remove a review that adds no judgment, strengthen a default that prevents a recurring mistake, or improve a dashboard and runbook that repeatedly slow response. Operational maturity is the ability to change the system without losing the explanation for why it is trustworthy.
Key takeaways
- Observability dashboards start with a clear operating decision and a named accountable owner.
- Make service objectives, metric definitions, dashboard versions, alert links, trace or log queries, and the owner for each panel available as evidence close to the work rather than reconstructing them after a failure.
- Test observability dashboards against normal work and adverse cases, including a simulated latency regression, a dependency failure, a recent deployment, and a user report that requires moving from a symptom to a likely cause.
- Use dashboard load time, panel freshness, alert investigation time, missing telemetry, abandoned panels, and repeated requests for manual data pulls to review the quality of decisions, not merely completion volume.
- Keep exceptions explicit, time-bounded, and connected to a safe fallback or escalation route.
- Expand only after one workflow can be operated, observed, and improved by the people who own it.
Frequently asked questions
How much process does observability dashboards need? Start with the smallest set of rules that lets a team answer who may act, what evidence is needed, and how to recover from a bad result. Add detail when a real failure, audit need, or change rate shows that the current rule is insufficient. The goal is reliable work, not a ceremonial checklist.
Should observability dashboards be automated? Automate repeatable checks and constrained actions when the inputs and expected outcome are well understood. Keep accountable human review where context, customer consequence, or an exception must be judged. Automation should make the decision trace easier to inspect, not hide it behind an opaque job.
When should the team revise observability dashboards? Review it after a material architecture change, recurring exception, failed test, incident, or ownership shift. A scheduled review is useful, but a real operational surprise is a stronger signal that an assumption, runbook, or control needs attention.
Conclusion
Observability dashboards become dependable when they give teams a repeatable way to decide, act, verify, and learn. Define the boundary, preserve the few records that explain material choices, and rehearse recovery before relying on the workflow at scale. That work makes delivery calmer for operators and clearer for the people depending on the service. Begin with the narrowest valuable path, measure its behavior in real conditions, and make every expansion earn trust through evidence.