Inventory and operations dashboards is dependable only when product, security and operations teams agree on the business outcome, system boundary, failure behavior and evidence required for release. The work is not complete when a feature appears in a demonstration. It is complete when representative users can perform the intended journey, unauthorized or malformed actions are rejected, operational teams can explain the resulting state, and recovery has been exercised. This guide turns those expectations into a practical implementation and review model for operations, warehouse, finance, procurement and engineering teams.
GS1 frames traceability around identification, capture and sharing, including critical tracking events and key data elements. A dashboard must preserve that event meaning instead of hiding uncertainty behind a current-stock number. The approach below uses current primary guidance and makes trade-offs explicit rather than treating one architecture or tool as universally correct. It preserves the existing article URL while replacing generic advice with concrete decisions, tests, ownership and acceptance evidence. Related implementation pages are listed at the end so readers can continue into narrower planning detail.
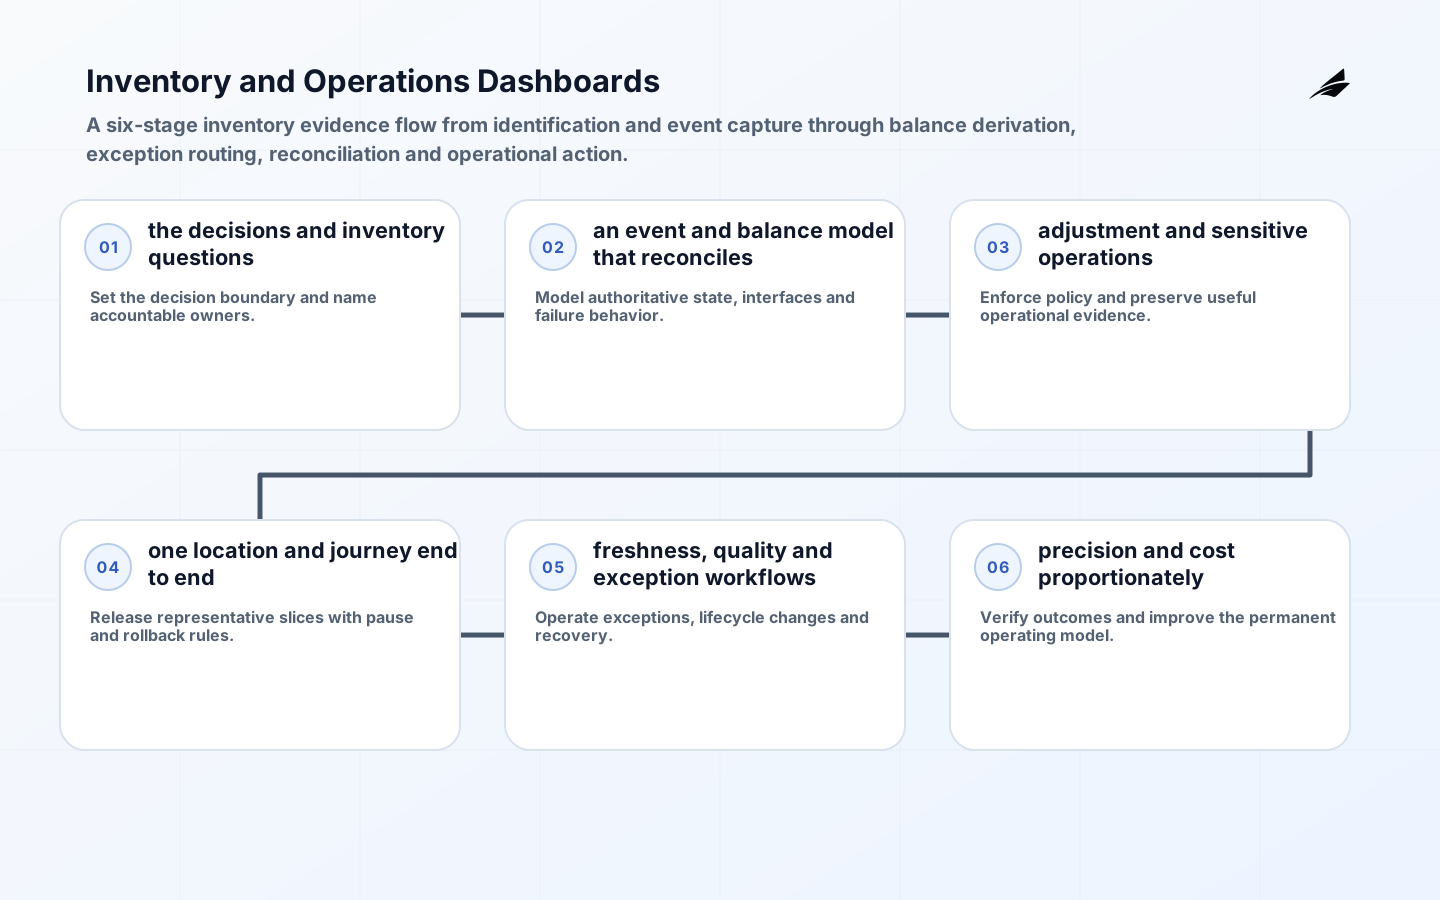
Define the decisions and inventory questions
Start by writing the decision or service outcome in one sentence and naming who depends on it. Define acceptable timeliness, accuracy, availability and recovery, then connect those measures to the user journey. For inventory and operations dashboards, the most important boundary is which items, lots, locations, ownership states, events and time windows each metric represents. State exclusions and assumptions openly. A requirement that cannot be observed or tested should be rewritten before it becomes architecture.
For inventory and operations dashboards, map the actors, records, interfaces and suppliers that participate in the outcome. Include human approvals, scheduled jobs and support actions, not only interactive screens. Assign one accountable owner for the complete journey and technical owners for each component. Record who may accept risk, authorize a consequential change and declare recovery. This avoids a common failure in which every component is monitored but nobody owns the result seen by the customer or business team.
| Planning decision | Evidence required | Stop condition |
|---|---|---|
| Metric | Definition evidence | Misleading shortcut |
| On hand | Location and condition included | All units treated as sellable |
| Available | Reservations and safety stock applied | On hand minus open orders |
| In transit | Dispatch and receipt events linked | Shipment status without quantity |
| Accuracy | Physical count comparison method | System-to-system agreement only |
Build an event and balance model that reconciles
Use stable identifiers for item, lot or serial, location, party, asset and transaction. Preserve receipts, moves, picks, adjustments, returns and transformations as events with event and record times. Keep identifiers stable across requests, events, logs and reports so an operator can reconstruct what happened without joining records by guesswork. Define source-of-truth ownership and synchronization behavior for every replicated field. If two systems may legitimately disagree, state which one controls each decision and how reconciliation occurs.
Derive balances from controlled events and reconcile them with authoritative ledgers and physical counts. Keep on-hand, available, reserved, in-transit, damaged and quarantined quantities distinct. Treat bulk operations and exceptional paths as first-class architecture. Preview target scope, enforce limits, make retries idempotent and preserve enough evidence to distinguish a repeated request from a new instruction. The design should remain understandable under partial failure; silent compensation and hidden manual repair make the apparent success rate unreliable.
Protect adjustment and sensitive operations
Authorize adjustments, transfers and write-offs by action, location and value. Require reason codes and stronger approval above thresholds; do not allow dashboard editing to become ledger editing. Enforce policy at the server or authoritative service boundary rather than trusting a browser, client-supplied role or display filter. Deny by default where consequence warrants it. Test horizontal access, stale membership, disabled accounts, background workers and support tooling because controls often differ outside the primary interface.
Protect commercially sensitive supplier, customer and location data. Log exports and bulk changes while retaining enough context to investigate shrinkage and process failure. Log the decision inputs, policy version, actor, target, outcome and correlation identifier while excluding secrets and unnecessary personal data. Alerts should represent violated expectations rather than raw event volume. Every high-severity alert needs an owner, a runbook and a tested escalation route. Evidence should support both immediate diagnosis and later review.
Deliver one location and journey end to end
Start with one high-value decision such as preventing stockout or finding delayed transfers. Integrate scanner or operational events, master data and order state through the real path. Build a representative vertical slice before expanding breadth. The slice should cross the real identity, data, integration and observability paths and include one failure and recovery scenario. Use production-like scale and policy where practical. A prototype that bypasses the hardest dependency proves interface design, not operational readiness.
Run in parallel with existing reports, investigate differences and train operators on exceptions. Expand only after definitions and reconciliation are stable. Release through observable cohorts with explicit entry, success, pause and rollback rules. Compare technical signals with business outcomes and support contacts. Preserve configuration and data migrations in version-controlled, repeatable mechanisms. When an exception is approved, record its owner, reason, expiry and compensating measure rather than weakening the standard silently.
| Delivery gate | Minimum proof | Owner question |
|---|---|---|
| Freshness | Source watermark and lag | Can users see incomplete periods? |
| Traceability | Item-event-location path | Can a lot be found both directions? |
| Exception | Owner, age and resolution | Does every red metric create work? |
| Reconciliation | Ledger and physical samples | Which source settles a dispute? |
Operate freshness, quality and exception workflows
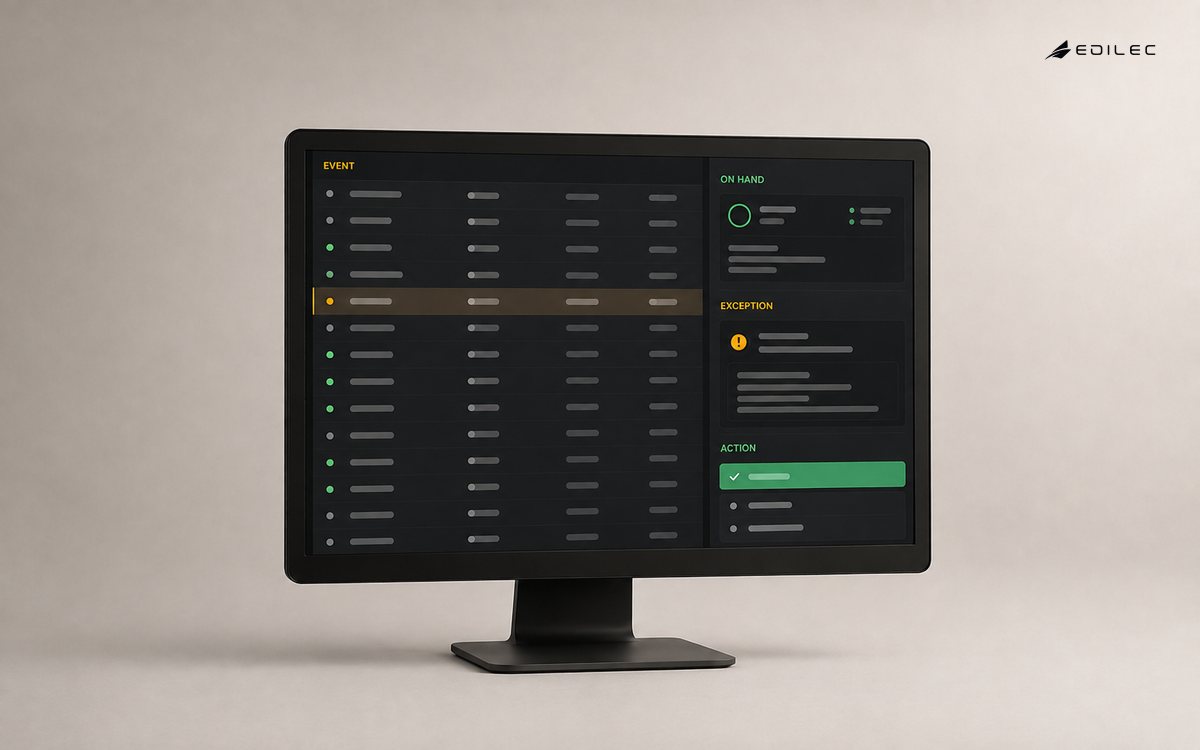
Display freshness, coverage and unresolved exceptions beside KPIs. A dashboard should show missing scanners, delayed integrations and unmapped items before presenting totals as complete. Dashboards should answer what changed, who is affected, whether the result is trustworthy and what action is expected. Separate service health, data quality, security and business outcomes so one healthy aggregate cannot hide another failing dimension. Include freshness and coverage. A green chart built from delayed or incomplete data is a particularly dangerous failure mode.
Route negative stock, aging reservations, overdue receipts, count variance and stuck work to named queues with service targets and closure evidence. Exercise routine and disruptive operations: onboarding, access change, configuration rollout, failed dependency, backup restoration, credential rotation, ownership transfer and retirement. Measure elapsed time and manual effort, then improve the runbook and automation. Operational acceptance belongs before broad launch because the first incident is an expensive place to discover missing authority or evidence.
Plan precision and cost proportionately
Choose class, lot or serial precision according to recall, warranty, safety and value needs. More precision increases capture and governance cost. Estimate cost from enduring operating work as well as initial delivery. Include data cleanup, integration change, testing, support, observability, security review, supplier coordination, migration overlap and exit. Distinguish fixed platform cost, variable usage cost and human operating load. An apparently inexpensive design can become costly when every new customer, site or workflow requires bespoke intervention.
Avoid optimizing a local metric at the expense of end-to-end flow. High utilization can increase queues; low inventory can harm service. Pair measures with the decision and consequence. Maintain a risk register with observable triggers and named treatment owners. Review concentration risk, unsupported dependencies, data-quality gaps, privilege accumulation, performance saturation and recovery uncertainty. Avoid false precision in cost or schedule estimates; give ranges, assumptions and decisions that would change the estimate.
Accept the dashboard with physical and financial evidence
Trace sample items backward and forward across receipt, movement, consumption, return and adjustment. Reconcile dashboard, ledger and physical evidence. Acceptance should be demonstrated by a cross-functional team using representative data and identities. Require successful ordinary journeys, rejected unauthorized actions, controlled partial failure, reconciliation, observable recovery and export of required evidence. Sample reported totals against authoritative records rather than accepting dashboard agreement with itself.
Test late, duplicate, out-of-order and corrected events. Verify deterministic convergence and visible exception ownership. Transfer ownership with maintained documentation, source and configuration access, alert routing, support procedures and a backlog of known limitations. Set a review date for assumptions and thresholds. A sustainable result is one the permanent team can explain, operate and improve without relying on the original project members for hidden context.
Review inventory and operations dashboards: from events to trusted decisions as a living operating capability after launch. At each review, compare the documented boundary with production configuration, recent incidents, support work, supplier changes and measured outcomes. Sample evidence rather than relying only on aggregate status. Record decisions, owners and due dates, and retire controls or reports that no longer support a real risk or business need. This cadence keeps architecture, policy and day-to-day practice aligned as customer volume, integrations, regulations and team responsibilities change.
Key takeaways
- Start with decisions, not a catalog of charts.
- Preserve inventory events and reconcile derived balances.
- Keep on-hand, available, reserved and in-transit meanings separate.
- Show freshness and data-quality exceptions prominently.
- Connect every exception to an owner and closure path.
Frequently asked questions
Must an inventory dashboard be real time?
Only when the decision needs it. State the required freshness per journey and expose actual lag. A reliable five-minute view can be better than a fragile “live” number.
Should the system prevent negative inventory?
It should prevent or route it according to business reality. Offline sales, corrections and timing can create legitimate temporary negatives; hide none of them and require owned reconciliation.
Which inventory KPI should come first?
Choose the decision: service level, count accuracy, stockout, aging, shrinkage or flow. Define numerator, denominator, population, timing and owner before visual design.
What is the source of truth for inventory?
Often no single database explains every state. Define authority by fact and process, then reconcile ERP, warehouse, commerce and event records against physical evidence.
Conclusion
Trusted inventory dashboards make physical flow explainable. They use stable identities and events, distinguish operational states, expose freshness and route exceptions to action. When teams can trace a displayed number back to movements and reconcile it with ledger and physical evidence, the dashboard becomes a control surface for operations rather than another report that users debate.