An edge dashboard presents operational information close to where data is produced or action is taken: a site, vehicle, store, facility or field location. It may run on a gateway, local server, kiosk, rugged device or browser connected to an edge service. Its value is not simply lower network latency. The design must remain understandable during disconnection, distinguish observed from synchronized state, protect operational technology and avoid turning a monitoring interface into an unsafe control path.
This FAQ addresses architecture, data, interaction, security and rollout questions. The companion edge dashboard implementation checklist converts the answers into evidence gates.
What makes a dashboard an edge dashboard?
It performs some acquisition, processing, storage or presentation outside a central cloud or data center, near the relevant assets and users. The boundary is architectural rather than visual. A browser showing centrally processed telemetry is a conventional dashboard even when used on site. A local service that normalizes device data, evaluates rules, stores recent history and serves the interface through a disconnected period is an edge workload.
W3C’s Web of Things architecture describes things, gateways, edge and cloud components without prescribing one deployment. Use that flexibility to place functions according to latency, safety, bandwidth, privacy, manageability and failure needs. Keep authoritative business history or fleet analytics central when local placement adds no decision value.
Which use cases fit the edge?
| Use case | Why local processing helps | Boundary to preserve |
|---|---|---|
| Operator awareness | Current state remains visible during WAN loss | Show timestamp and source health |
| Local exception triage | Rules can prioritize nearby events quickly | Keep human confirmation and escalation |
| Bandwidth reduction | Aggregate high-frequency telemetry before transfer | Retain required detail and provenance |
| Site privacy | Sensitive raw data can remain local | Govern derived and exported data |
| Resilient workflow | Approved tasks continue through disconnection | Define conflict and synchronization rules |
| Fleet comparison | Usually benefits from central aggregation | Avoid implying local view is fleet-wide |
Do not use edge placement to bypass source-system governance or safety engineering. If a dashboard can issue commands, treat monitoring and control as separate capabilities with distinct authorization, confirmation, interlocks and audit. NIST SP 800-82 emphasizes that OT security must respect safety, performance and reliability.
What should the data path look like?
A common path is device or control system to protocol adapter, local broker or collector, normalization and validation, local time-series or state store, dashboard service, then controlled synchronization upstream. Preserve device identity, event time, ingestion time, units, quality and sequence where available. Keep raw and derived state distinguishable. Avoid direct browser connections to controllers; a bounded service can enforce contracts, rates and permissions.
| Layer | Responsibility | Failure signal |
|---|---|---|
| Acquisition | Authenticate source and capture data | Disconnect, parse error or sequence gap |
| Normalization | Apply units, schema and quality flags | Unknown unit or invalid value |
| Local storage | Retain approved history and queue | Capacity pressure or write failure |
| Analytics | Derive states and alerts from versioned logic | Rule error or stale input |
| Presentation | Show state, provenance and interaction | Stale view or client disconnect |
| Synchronization | Transfer and reconcile with central systems | Backlog age, conflict or reject |
Does MQTT guarantee reliable dashboard data?
MQTT 5.0 defines publish-subscribe behavior and three qualities of service. Those levels describe message delivery between a client and server, not end-to-end correctness. Duplicate delivery, retained messages, session state, application retries and source resets still require design. Use stable event identifiers, sequence or timestamps, idempotent consumers and explicit quality flags. Select delivery quality per data consequence and device constraints rather than applying the highest level universally.
How should the dashboard behave offline?
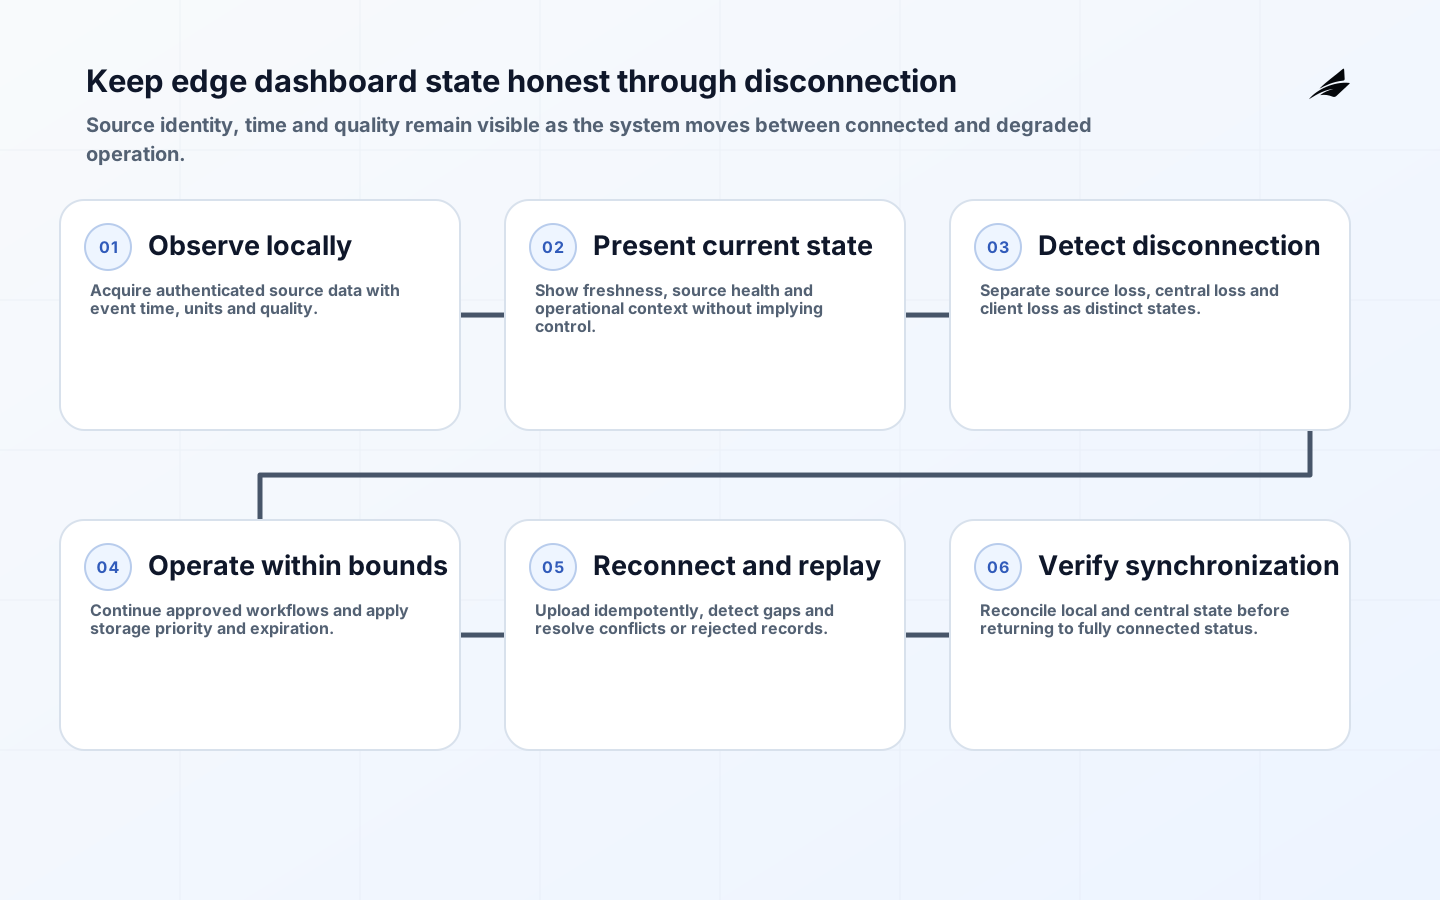
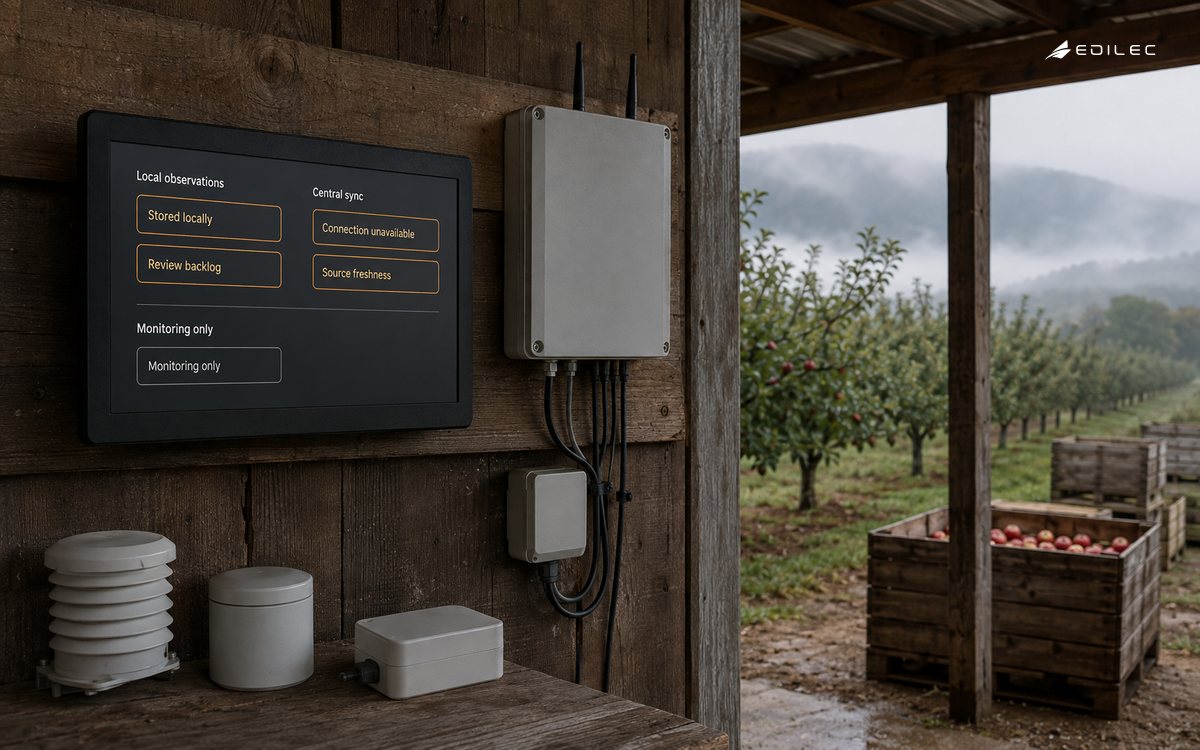
Design offline as an explicit state. Microsoft’s IoT Edge documentation illustrates local authentication, store-and-forward and later synchronization, while noting that retention depends on time-to-live and available storage. Show connection state, last successful source update, last central synchronization and backlog health separately. Continue only workflows whose rules and data remain valid locally.
- Cache approved identity and policy only for a defined duration and revocation model.
- Size local storage from arrival rate, outage assumption and retention priority.
- Prioritize critical events when capacity is constrained; expose loss or expiry.
- Queue idempotent outbound actions with user, time and local identifier.
- Reconcile desired and reported state after reconnection.
- Test clock drift, reboot, full disk and repeated network flapping.
How should time and freshness be handled?
Capture event time at the source when trustworthy, ingestion time at the edge and synchronization time centrally. Define behavior for clock drift, time-zone display, daylight changes, out-of-order events and missing sequence. A freshness objective should follow the decision: an operator status tile may need a short window while a shift summary may tolerate later reconciliation. Label delayed and corrected points rather than silently redrawing history.
How should the interface differ from a central dashboard?
Prioritize scanability, state and action over dense exploration. Show current context, source health, freshness, units and alarm priority. Use text and shape in addition to color. Provide stable layouts for repeated operational use, keyboard access where relevant and alternatives for charts. WCAG 2.2 supplies testable web accessibility criteria, but field research must also consider lighting, gloves, vibration, kiosk distance, language and cognitive load.
Use progressive detail: fleet or site status, affected asset, trend and underlying event. Avoid animation that implies causality or urgency without evidence. For critical alarms, distinguish active, acknowledged, cleared and suppressed states. Explain whether a threshold came from device, edge rule or central policy.
How should security work at the edge?
Do not trust a request solely because it originates on a local network. NIST SP 800-207 frames access around users, assets and resources rather than network location. Give devices, services and people distinct identities; authorize the exact resource and action; protect credentials in hardware-backed storage where available; encrypt transport; restrict inbound exposure; and log administrative changes. Segment dashboard services from control networks according to OT risk and validate updates before deployment.
Plan certificate enrollment, rotation, expiry, revocation and replacement for disconnected sites. Secure boot, signed artifacts, least-privileged containers or processes and an inventory of deployed versions reduce fleet risk. Define a break-glass path that is time-bound, auditable and tested without making it a routine workaround.
What should operators monitor?
| Perspective | Signal | Decision |
|---|---|---|
| Device | Connectivity, clock, quality and sequence | Trust or quarantine source |
| Edge node | CPU, memory, disk, temperature and process health | Reduce load or service node |
| Data flow | Rate, lag, rejects and backlog age | Restore or prioritize flow |
| Dashboard | Render errors, stale views and client sessions | Support user experience |
| Security | Authentication failures, policy change and version | Investigate or contain |
| Synchronization | Transferred, expired, conflicted and rejected items | Reconcile central state |
Correlate metrics, logs and traces with site, node, software version and source identity while minimizing sensitive content. OpenTelemetry defines common signal types; edge systems must also buffer observability safely and avoid diagnostic traffic exhausting the connection needed for operational data.
Example: a local cold-storage dashboard
Consider a dashboard that shows chamber temperature, door state and sensor health at a distribution site. Local adapters normalize units and attach event and ingestion time. The interface shows current value, freshness and sensor quality; it does not infer product safety or issue equipment commands. During WAN loss, the site retains approved history and queues events. A central service later accepts idempotent uploads and flags sequence gaps for review.
The rollout tests sensor silence, bad units, clock drift, edge restart, full storage and reconnect. Operators confirm that stale values are unmistakable and that alarm acknowledgment remains locally auditable. This example describes a design method, not a claim about achieved safety or performance.
What are the main risks?
| Risk | Early sign | Control |
|---|---|---|
| Stale state appears current | No visible freshness or source health | State-aware presentation and objective |
| Unsafe control coupling | Monitoring identity can issue commands | Separate services, policy and confirmation |
| Storage exhaustion | Backlog grows without priority | Capacity model, expiry and alert |
| Clock disorder | Negative durations or reordered events | Multiple timestamps and drift handling |
| Fleet drift | Sites run unknown versions | Inventory, signed release and staged update |
| Sensitive local access | Shared credentials or broad kiosk session | Distinct identity, least privilege and timeout |
Key takeaways
- Place processing at the edge only where latency, resilience, bandwidth or privacy supports a decision.
- Treat source identity, time, quality and freshness as part of every displayed value.
- Design disconnection, storage pressure, replay and reconciliation before rollout.
- Separate monitoring from control and apply resource-level authorization at the edge.
- Test the interface with real operators and degraded conditions, then expand by site cohort.
Additional frequently asked questions
Does an edge dashboard replace the cloud?
Usually not. Local operation supports immediate site needs; central services support fleet analysis, durable history, governance and coordinated release. Define authority and synchronization explicitly.
Can the dashboard run on the same device as control software?
It may be technically possible, but shared resources and failure domains can affect critical functions. Evaluate safety, vendor support, isolation, capacity and update risk. A separate gateway or service is often easier to govern.
What latency should we promise?
Set a target from the decision and measure end to end from event to usable display. Device sampling, protocol, processing, rendering and network each contribute. Do not publish a number without workload and environment evidence.
Conclusion
A dependable edge dashboard communicates not only value but trust: where data came from, when it was observed, whether it is current and what remains possible during disconnection. Build that state model first, protect OT boundaries and prove degraded behavior before fleet expansion.