This checklist is for enterprise teams implementing dashboards at sites, gateways, vehicles or other constrained locations. It treats displayed state, offline operation, OT boundaries, accessibility, fleet updates and support as one system. Record evidence, owner, exception and review date for every gate. A successful demonstration on a stable network is not production readiness. The companion edge dashboard FAQ explains the decisions behind the controls.
Gate 1: Define the local decision and safety boundary
- Name users, location, task, frequency and consequence of wrong or late information.
- Identify which decisions must continue locally and which require central confirmation.
- State whether the product is monitoring-only or can initiate control.
- Assign business, site, OT, data, security, product and support owners.
- Define success measures, freshness needs, recovery expectations and excluded uses.
- Document environmental constraints such as display distance, lighting, gloves, language and connectivity.
Write scope around a workflow, such as triaging packaging-line exceptions during a WAN outage, rather than around charts. If commands are in scope, involve safety and control-system owners and separate command identity, authorization, confirmation, interlock and audit from monitoring.
Gate 2: Inventory assets, protocols and data
| Item | Required detail | Evidence |
|---|---|---|
| Device or controller | Owner, model, firmware, clock, identity and support | Verified inventory and sample data |
| Protocol | Version, transport, security and delivery behavior | Interface specification and capture |
| Signal | Meaning, units, range, quality and sampling | Source-owner approval and examples |
| Edge node | Hardware, OS, storage, runtime and network | Configuration and capacity record |
| Consumer device | Browser, kiosk, rugged client and assistive needs | Field observation and test matrix |
| Central service | Authority, synchronization, retention and access | Data-flow and ownership review |
Include serial gateways, protocol converters, manual inputs, local historians and vendor-managed components. Record whether timestamps come from source, gateway or application. Unknown units, clock behavior and device identity must be resolved before visual design.
Gate 3: Approve edge and central responsibilities
Use W3C Web of Things architecture as a conceptual reference for things, gateways, edge and cloud components, then document the actual deployment. Place acquisition, normalization, rules, local storage, presentation and synchronization according to latency, safety, privacy, bandwidth and manageability. Avoid direct browser access to controllers. Bound adapters and services can enforce schemas, rates, identity and failure handling.
| Capability | Local responsibility | Central responsibility |
|---|---|---|
| Identity | Authenticate approved cached principals and devices | Enrollment, policy authority and revocation |
| Data | Current state and bounded local history | Durable history and fleet aggregation |
| Rules | Approved site-critical evaluation | Version governance and cross-site analysis |
| Interface | Local operational workflow | Remote administration where permitted |
| Updates | Validate, stage and roll back artifact | Sign, approve and track fleet release |
| Support | Site diagnosis and safe fallback | Fleet visibility and coordinated response |
Gate 4: Preserve identity, time and quality
- Assign stable source and edge-node identities.
- Capture event, ingestion and synchronization time where relevant.
- Normalize units through versioned mappings without discarding raw value.
- Represent valid, suspect, missing, stale, corrected and simulated data distinctly.
- Detect sequence gaps, duplicates, out-of-order and implausible readings.
- Trace displayed values and derived states to source and rule version.
- Define retention and aggregation without erasing required evidence.
A chart needs a state model. Define how freshness changes when sampling stops, how corrected history appears, and whether an aggregate can remain valid when one source is missing. Use textual labels and shape as well as color for quality. Do not silently interpolate operational gaps.
Gate 5: Design messaging and replay
MQTT 5.0 provides publish-subscribe transport and delivery quality levels, but application correctness still needs identifiers, ordering, idempotency and reconciliation. Choose topic or channel structure, retained-message use, session behavior, delivery quality and expiration from data consequence. Test duplicate, delayed and reordered delivery. Define how a restarted source or gateway establishes a new sequence and how the dashboard avoids confusing an old retained value with live state.
- Use explicit schema and version for payloads.
- Bound retry and backoff to avoid saturating constrained links.
- Persist only messages whose loss consequence justifies storage.
- Apply idempotent processing to commands, acknowledgments and uploads.
- Expose expired or dropped data rather than hiding loss.
- Protect brokers and clients with distinct credentials and authorization.
Gate 6: Engineer offline and storage behavior
Microsoft’s IoT Edge offline guidance illustrates local authentication, message storage and later synchronization, while noting that retention depends on time-to-live and disk. Build a capacity model from arrival rate, outage assumption, record size, observability and safety margin. Define priority and expiration rather than allowing a full disk to decide. Show source connectivity, central connectivity, last source update, last synchronization and backlog separately.
| Scenario | Expected behavior | Test evidence |
|---|---|---|
| WAN loss | Approved local views continue; cloud-dependent actions disable | Observed state and user understanding |
| Source silence | Value becomes stale by defined rule | Freshness transition and alert |
| Disk pressure | Priority retention and visible loss policy activate | Capacity alarm and controlled expiry |
| Edge restart | State restores without presenting old data as current | Restart and reconciliation record |
| Clock drift | Events retain times and uncertainty is visible | Drift injection results |
| Network flapping | Retry remains bounded and backlog converges | Soak test and queue history |
Gate 7: Protect OT and edge resources
Apply NIST SP 800-82 guidance in the context of safety and reliability. Apply NIST SP 800-207 by authorizing users, devices and services to specific resources instead of trusting local network position. Segment dashboard services from control systems based on risk. Restrict inbound access, encrypt supported transport, protect credentials, validate signed updates, inventory versions and log administrative changes.
- Define device enrollment, certificate rotation, expiry, revocation and replacement.
- Separate monitoring permissions from control and maintenance.
- Use least-privileged service identities and time-bound operator sessions.
- Protect local secrets using suitable platform capabilities.
- Define auditable break-glass access and test its closure.
- Threat-model physical access, removable media, compromised gateway and remote support.
- Plan vulnerability response for components that cannot be patched immediately.
Gate 8: Build an accessible operational interface
Prioritize context, current state, freshness, quality and alarm priority. Use stable layouts, readable units, keyboard operation where relevant, chart alternatives and text or shape in addition to color. WCAG 2.2 provides testable web criteria; field testing adds lighting, viewing distance, gloves, noise, vibration and cognitive load. Distinguish active, acknowledged, cleared and suppressed alarms. Make threshold source and rule version discoverable.
Test with representative operators and hardware. Ask users to identify stale data, find the affected asset, explain alarm state and recover from a client reconnect. Measure task accuracy and confusion, not aesthetic preference alone. Avoid animation that implies urgency or causality without evidence.
Gate 9: Instrument support and fleet operation
| Layer | Signals | Owner action |
|---|---|---|
| Device | Connectivity, clock, quality and sequence | Trust, service or quarantine |
| Node | CPU, memory, disk, temperature and process | Reduce load or repair |
| Flow | Rate, lag, rejects and backlog age | Restore, prioritize or reconcile |
| Dashboard | Render errors, stale view and sessions | Support client |
| Security | Auth failures, policy change and version | Investigate or contain |
| Sync | Transferred, expired, conflicted and rejected | Resolve central state |
Correlate metrics, logs and traces with site, node, artifact and source identity while minimizing sensitive content. OpenTelemetry describes common signals; edge collection also needs buffering, priority and bandwidth limits. Diagnostic traffic must not crowd out operational data.
Gate 10: Test degraded conditions and recovery
- Validate protocol and schema with representative devices and malformed input.
- Test source silence, duplicates, ordering, resets, clock drift and unit error.
- Exercise WAN loss, DNS failure, slow link, captive proxy and repeated reconnect.
- Fill storage, restart processes, reboot the node and interrupt an update.
- Attempt unauthorized local, remote and cross-site access.
- Verify backup or reconstruction of configuration, rules and required local history.
- Run rollback and prove that fleet inventory reflects the deployed version.
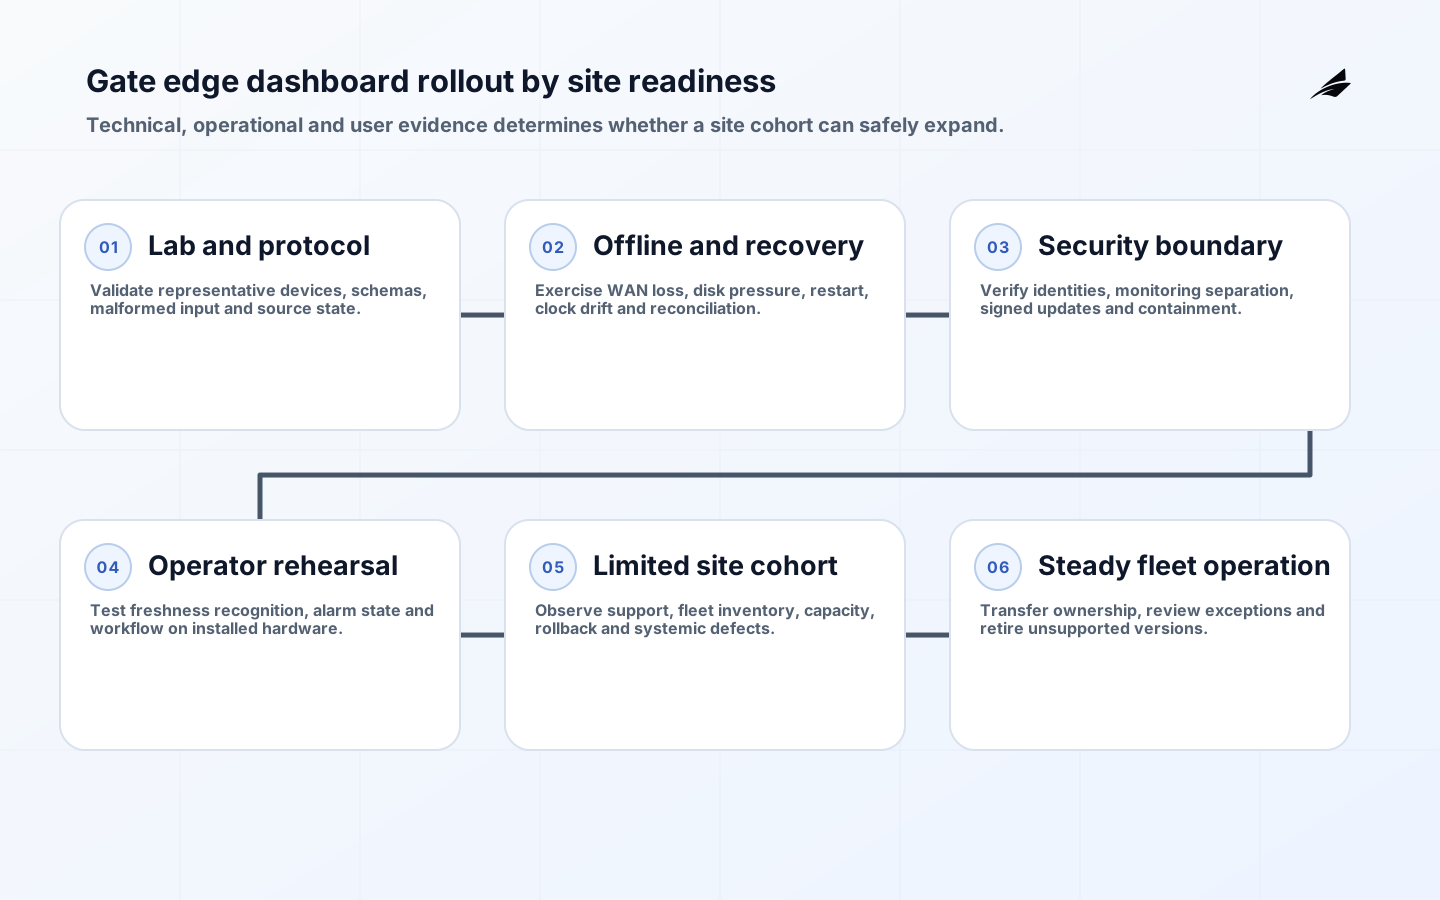
Gate 11: Roll out by site cohort
| Wave | Entry evidence | Exit decision |
|---|---|---|
| Lab | Representative hardware, protocol and fault injection | Core state model and recovery pass |
| Site rehearsal | Real network, display and operator walkthrough | Constraints and support path understood |
| Limited cohort | Approved sites, monitored release and rollback | Freshness, usability and fleet operations hold |
| Expanded cohort | Capacity, security and update evidence | No unresolved systemic defect |
| Steady operation | Site ownership, support, inventory and review cadence | Continue, improve or retire |
Define success, stop and rollback conditions before each wave. A rollback restores a known software or configuration state without erasing valid operational events. Reconcile queued data and actions after reconnect. Expand only when support can identify site, node, source, software version and data state without relying on the build team.
Example: a packaging-line monitoring dashboard
A monitoring-only dashboard shows machine state, reject counts and sensor health. A local adapter normalizes source codes and units, attaches source and ingestion time, and stores a bounded history. The interface marks stale or suspect data and cannot issue commands. During WAN loss it continues the approved local view while queuing summarized events for central upload.
Testing injects sensor silence, duplicate messages, a gateway reboot, full storage and clock drift. Operators verify alarm state and data freshness on the installed display. Central reconciliation detects sequence gaps after reconnect. The example describes acceptance method without asserting a duration, performance result or safety outcome.
Gate 12: Review risks and exceptions
| Risk | Evidence of control | Stop signal |
|---|---|---|
| Stale appears current | Visible freshness and source health | User cannot distinguish state |
| Control coupling | Separate identity and service boundary | Monitoring path can command |
| Storage exhaustion | Capacity, priority and expiry | Critical data displaced silently |
| Fleet drift | Signed release and inventory | Unknown deployed version |
| Local credential misuse | Distinct identity and session policy | Shared or persistent broad access |
| Unsupported component | Inventory and response plan | No containment or replacement path |
Key takeaways
- Scope the dashboard around a local decision and explicit monitoring or control boundary.
- Carry source identity, time, units, quality and freshness to the interface.
- Engineer offline storage, replay, pressure and synchronization as first-class behavior.
- Protect OT resources with specific identity, authorization, segmentation and signed change.
- Prove degraded operation with users and representative hardware before cohort expansion.
Frequently asked questions
When is a gate complete?
When repeatable evidence from representative hardware and conditions demonstrates the behavior, and the accountable owner accepts exceptions. A diagram or successful happy-path demonstration is insufficient for offline, security or recovery gates.
Can production telemetry be used in testing?
Use only when purpose, access, minimization, retention and environment controls are approved. Synthetic and replayable representative data are often safer and better for repeatable faults. Remove unnecessary identifiers.
How often should edge software be updated?
Use a risk-based policy covering vulnerabilities, compatibility and operational windows. The key capabilities are inventory, signed artifacts, staged cohorts, health observation and rollback; a universal calendar does not fit every estate.
How long should offline mode last?
Derive it from the business outage scenario, arrival rate, storage, data priority, credential validity and site support. Validate with a capacity and recovery test rather than a generic promise.
Conclusion
An edge dashboard is ready when it remains honest about source and freshness, degrades predictably, protects operational boundaries and can be updated and supported across a fleet. These gates make those properties testable before wider site exposure.