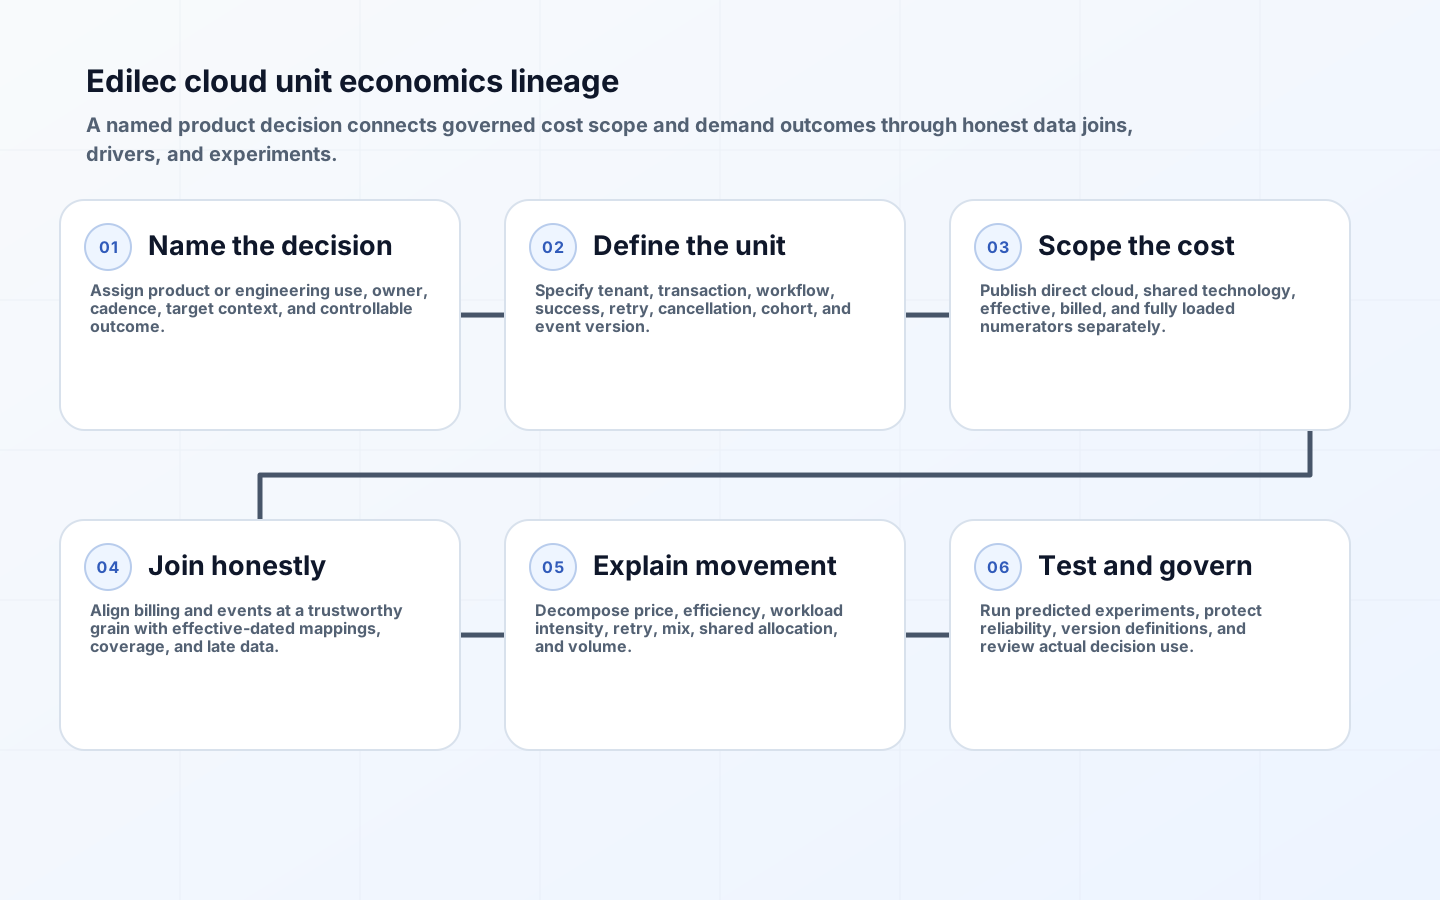
Cloud unit economics connects technology cost to a unit of demand or value: tenant, transaction, successful workflow, case resolved, gigabyte processed, or another outcome. The division is easy; choosing a denominator that remains meaningful under retries, failures, product changes, and shared infrastructure is not. A trustworthy unit metric has a decision, population, cost scope, event definition, time grain, allocation policy, data-quality score, and owner.
The FinOps unit economics capability distinguishes resource-efficiency metrics from business unit metrics and emphasizes decision use. Cost per vCPU hour helps engineering tune infrastructure; cost per completed order helps product and finance discuss margin. Both can be useful, but they answer different questions. Do not force one ratio to serve capacity, pricing, customer profitability, and executive reporting without explicit bridges between them.
Choose the decision and unit before the formula
Write a decision statement: “Product and engineering will use cost per successful document workflow by customer tier to evaluate pricing and architecture each month.” Define a successful workflow, cancellation, retry, partial completion, batch, free tier, internal use, and late event. Identify who can change the outcome. A denominator that nobody controls becomes a retrospective fact, not an operating signal.

Choose tenant when cost-to-serve and customer segmentation matter, transaction when volume and processing efficiency matter, and workflow when several technical operations deliver one product outcome. Often a metric tree is best: cost per workflow equals resource cost per technical operation, operations per attempt, and attempts per successful workflow. That decomposition lets teams distinguish infrastructure efficiency from product behavior such as retries or abandonment.
| Unit | Best decision | Definition hazard | Useful breakdown |
|---|---|---|---|
| Active tenant | service tier and cost-to-serve | inactive or internal tenants inflate denominator | tier, region, cohort |
| Transaction | throughput and architecture | attempts, retries and reversals | type, outcome, channel |
| Successful workflow | product value and margin | multi-step completion and late events | product, tier, version |
| Request | service efficiency | not every request carries equal work | route, status class |
| GB processed | data-platform efficiency | logical and physical bytes differ | engine, workload class |
| Case resolved | automation value | quality and reopen rates matter | resolution type, satisfaction |
Define direct and fully loaded cost scopes
Start with a controllable direct-cloud view: compute, storage, network, managed services, and usage-priced software attributable to the product. Then add shared platform, observability, security, data, support, and commitment effects under documented rules to create a fully loaded technology view. Finance may add labor or other cost for a broader margin view. Publish scopes separately; changing the numerator without changing the metric name destroys trend interpretation.
Use effective cost for many consumption decisions, cash or billed cost for invoice and budget views, and on-demand equivalent for rate-optimization analysis. Treat credits, refunds, taxes, support, and marketplace charges explicitly. The FOCUS 1.4 specification helps normalize billing concepts, but allocation still needs ownership and shared-cost policy. Keep unknown and unallocated cost visible rather than distributing it through a denominator that makes it disappear.
Join billing cost to demand without false precision
Cloud billing may arrive hourly or daily with late corrections; product events may be near real time and mutable. Land both with event time, ingestion time, source version, and stable identifiers. Aggregate to the coarsest trustworthy common grain before joining, often product, environment, region, and day. Do not assign account-level support cost to individual transactions with six decimal places and then imply measurement accuracy.
Maintain bridge tables for service-to-product, account-to-owner, tenant-to-tier, and workflow-version definitions with effective dates. This preserves history when organizations or products change. Deduplicate events, reconcile counts to product systems, handle late completion, and exclude synthetic or internal traffic according to policy. Publish numerator coverage, denominator coverage, unallocated amount, freshness, and estimated share next to the ratio.
| Field | Example | Control | Failure signal |
|---|---|---|---|
| Decision | evaluate premium-tier margin | named review cadence | metric never appears in decision |
| Population | production paid workflows | versioned inclusion rule | unexplained denominator jump |
| Numerator | fully loaded technology effective cost | reconciled cost scope | unallocated or unreconciled growth |
| Denominator | success event after final state | event-quality tests | retry or duplicate inflation |
| Grain | product, tier and month | compatible source aggregation | sparse misleading cohorts |
| Confidence | coverage and estimation bands | published quality threshold | ratio shown without caveat |
Interpret unit-cost change through drivers
A lower average can come from real efficiency, greater utilization of fixed capacity, a customer-mix shift, discount application, reduced reliability, or an incomplete numerator. Decompose period change into price, resource efficiency, workload intensity, retries, mix, shared-cost allocation, and volume. Compare like cohorts and product versions. Weighted averages can hide a high-cost small tier or make a growing low-cost tier appear to improve every tenant.
Use marginal and average views together. Average fully loaded cost supports pricing and portfolio decisions; marginal cost estimates what the next unit requires within current capacity. The next workflow may use already-paid capacity, yet sustained growth can cross a scaling step and require a new database tier. Model capacity bands rather than claiming one constant marginal rate. Keep service quality beside cost: failed or slow workflows are not economic wins.
Operationalize targets and experiments
Set a target range with business context instead of a universal “down.” A launch may tolerate higher unit cost while learning; a mature service may target stability or controlled decline. Connect drivers to owners: engineering can change compute per operation, product can change workflow retries, procurement can change rates, and finance can change allocation policy. Review metric changes with deployment, demand, and incident annotations.
Use experiments to validate causality. Before a cache change, predict resource use, success rate, and cost per workflow; then compare a controlled cohort. Record whether savings persist across a full billing cycle and whether shared or commitment costs moved elsewhere. The FinOps Introduction to Cloud Unit Economics frames these metrics as a common language between engineering and business. Their credibility comes from reproducibility and decisions, not dashboard polish.
Handle sparse and heterogeneous tenants carefully. Averages for a tiny cohort swing with one batch job, while a large enterprise tenant may have obligations that make comparison with self-service customers meaningless. Publish counts and confidence bands, suppress or aggregate groups that would reveal customer behavior, and avoid ranking named tenants unless access and purpose are approved. Use medians, percentiles, or cost distributions when they answer the decision better than a mean, but retain the reconciled total so statistical summaries do not lose financial accountability.
Version denominator events like APIs. If product changes redefine a completed workflow, introduce a new event version and bridge old to new where valid. Run dual counting during release, compare completion and retry patterns, and annotate the metric. Never backfill a new business definition across history unless source data truly supports it; instead publish a break in series. Assign data-product ownership for both numerator and denominator, because a pristine billing model joined to duplicated events produces a confident but wrong unit cost.
Build access controls around tenant economics. Product managers may need cohort trends while account teams see only their customers and engineers see technical drivers without revenue. Define row and column policies, minimum cohort sizes, export restrictions, and audit logging. Cost data joined with customer identity, contract tier, or margin can be commercially sensitive even when neither source was sensitive alone. Provide de-identified engineering views and a governed escalation path for detailed investigations. Security of the joined dataset is part of metric quality because uncontrolled access can prevent the business from supplying the denominator detail that makes the metric useful.
Add reconciliation from the metric tree back to total product cost and total outcomes. Segments should sum to the governed numerator except for an explicit unallocated category, and outcome classes should bridge to the authoritative event total. This catches missing tiers, overlapping cohorts, and filters that make every segment look efficient while omitting expensive failures. Publish the bridge with each close so detailed unit views never drift away from the amount finance and product leadership recognize.
Key takeaways
- Tie every unit metric to a named decision, owner, population, and review cadence.
- Use a metric tree to connect technical efficiency with tenant, transaction, or workflow outcomes.
- Publish direct, fully loaded, and financial cost scopes separately.
- Join sources at a trustworthy common grain and expose coverage, estimates, and late data.
- Decompose change and keep reliability, mix, average cost, and marginal capacity effects visible.
Frequently asked questions
Is tenant, transaction, or workflow the best unit?
The best unit is the one that maps to the decision and value model. Use several linked levels when engineering and product need different controls.
Should unit cost include only cloud bills?
Keep a direct-cloud view for engineering, then add shared technology or broader finance scopes as separate named metrics. Do not silently change the numerator.
Is rising unit cost always bad?
No. Quality, resilience, customer mix, or strategic capability may improve value. Explain the drivers and compare cost with the intended outcome.
Conclusion
Cloud unit economics is useful when a ratio carries enough lineage to guide action. Define the outcome carefully, preserve cost scopes, join demand and billing honestly, and decompose movement into controllable drivers. Then cost per tenant, transaction, or workflow becomes a common language for architecture and product value rather than a deceptively precise division.