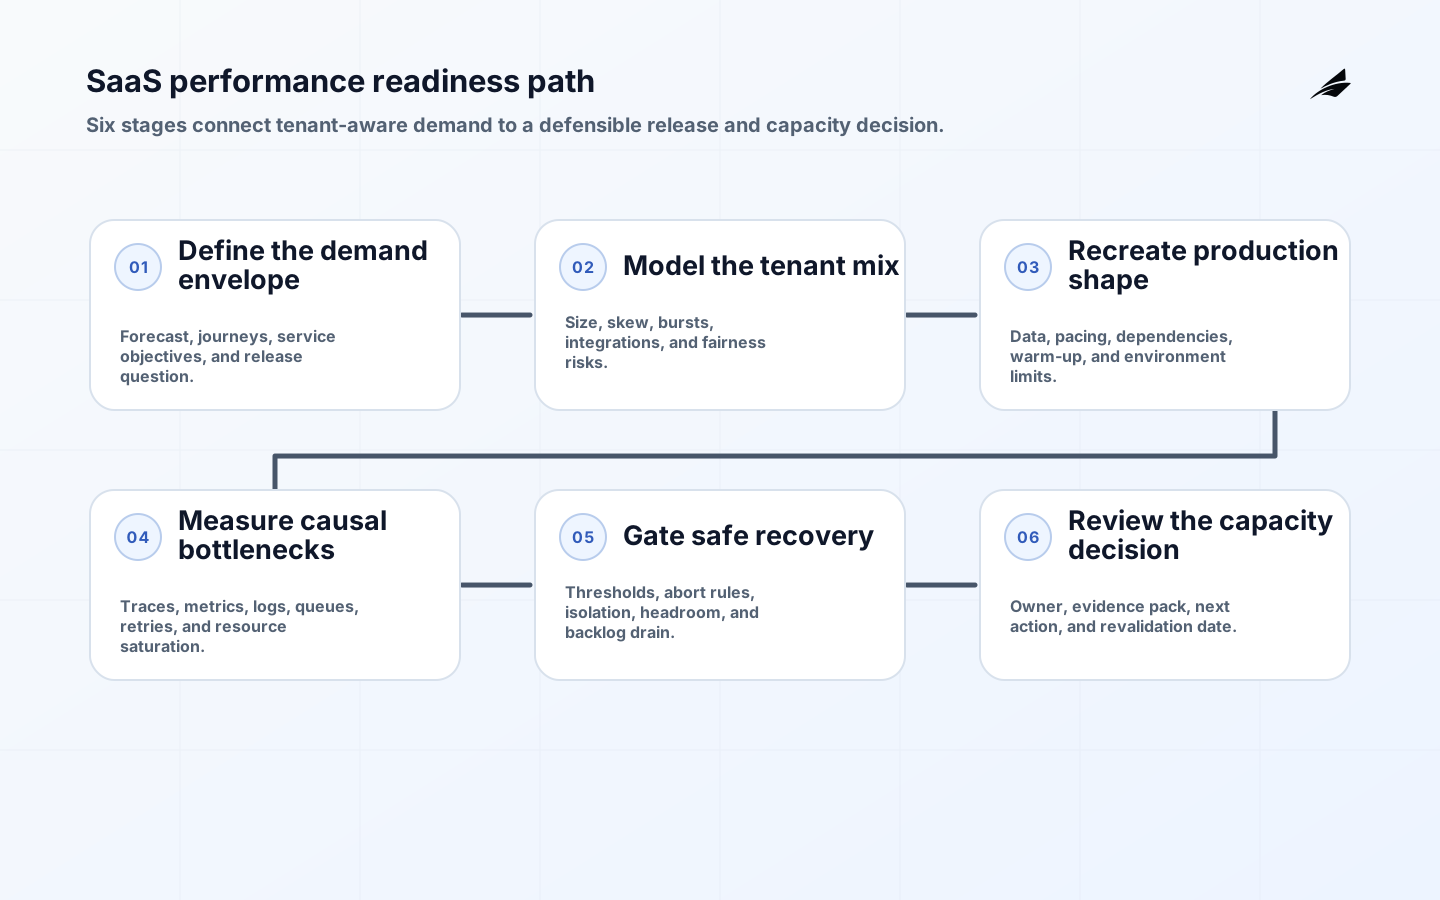
A SaaS performance testing implementation plan should prove that representative customers can complete important work within agreed limits while other tenants, background jobs, and dependencies compete for capacity. A single requests-per-second number cannot answer that question. The useful evidence includes user-journey latency, correctness under concurrency, queue delay, resource saturation, tenant fairness, and recovery after the test stops. It also states what the environment can and cannot predict about production.
Start with a release or capacity decision, then design the test to answer it. The SaaS performance testing delivery plan can frame investment and risk; this readiness checklist turns that scope into executable evidence. Product, engineering, platform, data, security, and support owners should agree on the decision before anyone spends time tuning a script.
Define the release decision before the workload
Name the journeys that matter and what successful completion means for each. Login, search, checkout, report generation, import, webhook processing, and administration have different urgency and different failure consequences. Set a percentile latency target, an acceptable error rate, a maximum queue age, and a correctness assertion. An asynchronous job is not successful merely because its HTTP acknowledgement is fast if the promised record never appears or is written twice.
Use a forecast that includes ordinary demand, planned launches, seasonality, large customers, and a plausible burst. Record the horizon for which the result is intended. If the business cannot name the demand assumption, the team cannot say whether a failed run requires code work, more capacity, a product limit, or a revised forecast. That distinction makes test results useful in funding and release conversations.
| Decision | Question to answer | Evidence to retain | Owner |
|---|---|---|---|
| Release | Does the candidate preserve user and business objectives? | Versioned workload, thresholds, correctness checks, and result comparison | Product and release lead |
| Capacity | What demand can the current topology serve with headroom? | Safe operating range, first saturation point, and scale delay | Platform owner |
| Architecture | Which boundary or dependency limits growth? | Correlated traces, resource data, queue age, and bottleneck hypothesis | Service owner |
| Tenant fairness | Can one account harm other accounts? | Cohort results, throttling behavior, and cross-tenant assertions | SaaS product owner |
Model tenant-aware demand instead of average traffic
A multi-tenant performance test needs a distribution of customers, not identical virtual accounts. Represent small steady tenants, large tenants with deep data, bursty API users, integration-heavy tenants, and background-heavy tenants. Carry a bounded tenant cohort through the fixture and telemetry so a fleet average cannot conceal one customer being throttled or starved. Include skew in record counts and permissions because a database and authorization layer often behave differently when one tenant owns most of the data.
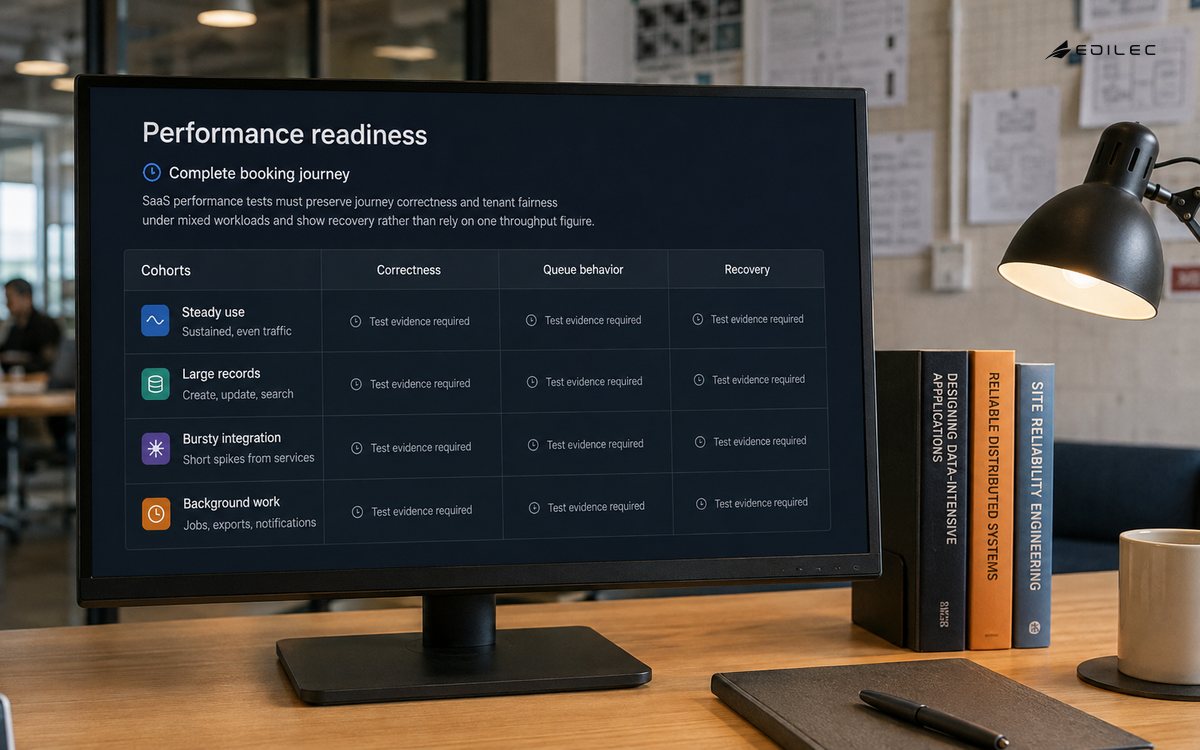
AWS SaaS guidance treats cross-tenant impact, tenant consumption, tenant workflows, onboarding, throttling, data distribution, and isolation as distinct testing concerns. Use that distinction to vary one demand dimension at a time. Add think time, session expiry, pagination, cache warm-up, retries, webhooks, and batch overlap. A script that repeats one cheap GET call may generate noise without reproducing the locks, queues, fan-out, or fairness problems that customers experience.
| Tenant profile | Load shape | Risk to observe | Required assertion |
|---|---|---|---|
| Small steady account | Low rate with normal user pacing | Baseline usability is lost during fleet growth | Journey latency stays within the service objective |
| Large data account | Deep searches, reports, and imports | Query plans or storage limits dominate tail latency | Results remain complete and tenant-scoped |
| Bursting API account | Short spikes and retries | One customer consumes shared capacity | Quota or throttling is fast and explainable |
| Integration-heavy account | Webhooks and third-party calls | Retries amplify downstream pressure | Events are authenticated, deduplicated, and reconciled |
Choose the test shape that matches the question
Use protocol-level tests for efficient concurrency and precise service or API pressure. Use a smaller browser cohort to measure rendering, interaction, and the first mile of user experience. Use end-to-end journeys when the decision depends on the whole path, including authentication, data writes, queues, and downstream effects. A hybrid plan is often more informative than trying to make every virtual user a full browser.
- Smoke the script and business assertions before adding load.
- Establish a stable baseline with the candidate version.
- Run expected demand, then explore the boundary in controlled increments.
- Use spike tests for abrupt demand and soak tests for leaks or queue accumulation.
- Keep browser tests focused on journeys that protocol tests cannot represent.
- Stop a run when the abort condition protects the environment or customer data.
Make the environment explainable and repeatable
Document topology, service tiers, region, network path, database engine and cardinality, cache state, autoscaling limits, feature flags, and external-service substitutes. A smaller environment can provide useful comparisons, but its absolute capacity cannot be projected by simple multiplication when queues, databases, and dependencies scale differently. State the differences beside every result rather than hiding them in a test appendix.
Seed production-like volume and skew with governed data, then reset it predictably. Version the application, infrastructure, scenario, fixtures, configuration, and result schema together. Confirm that the load generator has spare CPU and network capacity; otherwise the generator becomes the bottleneck. Separate cold-start observations from warmed steady state, and record whether caches, connections, indexes, and background workers had reached normal operating conditions.
Instrument evidence that explains the result
Correlate the test request with traces, metrics, and structured logs across the entire path. OpenTelemetry describes traces as the path of a request, metrics as runtime measurements, and logs as event records; together they can show whether tail latency came from application work, a database wait, a queue, a retry, or a dependency. Tag by scenario, route, release, and bounded tenant cohort. Avoid raw user identifiers and uncontrolled high-cardinality labels.
Measure attempted work as well as completed business effects. Client retries can preserve an apparent success rate while multiplying downstream work and user delay. Watch concurrency, percentile latency, errors, queue age, database waits, connection pools, cache hit rate, CPU, memory, garbage collection, and dependency limits. If the team cannot explain why a threshold failed, the run has produced a symptom rather than a decision.
Set thresholds, gates, and abort rules in advance
Grafana k6 treats thresholds as pass-or-fail criteria and supports percentile, error-rate, custom-metric, and abort conditions. Translate each service objective into a named threshold before execution. Combine technical limits with business assertions: a fast response that returns another tenant's record is a failure even if its latency is excellent. Add a comparison limit for regressions when an absolute target is too generous.
A failed threshold should trigger triage, not repeated runs until one happens to pass. Define who can pause the test, how the environment is restored, what evidence is preserved, and when a result must be invalidated because the generator or dependency was unhealthy. Record changes to thresholds and rerun them; silently relaxing a target converts a performance test into retrospective justification.
| Readiness gate | Pass evidence | Stop condition |
|---|---|---|
| Workload fidelity | Reviewed journey mix, tenant profiles, data skew, and demand forecast | Material customer behavior is absent or unexplained |
| Correctness | Business assertions remain valid under concurrency, retries, and partial failure | Duplicate, stale, cross-tenant, or missing result appears |
| Service objective | Predeclared percentile, error, queue, and resource thresholds pass | A target fails or cannot be attributed to a known environment issue |
| Capacity | Safe range, headroom, autoscaling delay, and first limit are documented | The system reaches an unsafe boundary without a controlled response |
| Recovery | Backlog drains and service returns to objective after pressure ends | Recovery is unbounded or requires undocumented manual intervention |
Exercise recovery, isolation, and fairness
The useful boundary is not always the point at which every request fails. Test what happens when a dependency slows, an integration returns errors, a queue grows, a tenant exceeds its allowance, or a deployment scales late. Verify admission control, back-pressure, degraded responses, retry budgets, dead-letter handling, and operator escalation. Google SRE’s overload guidance is a reminder that request counts can be a poor capacity proxy when requests have different costs.
Run cross-tenant scenarios with a noisy account and quiet accounts in the same window. Confirm that throttling is quick, visible, and scoped to the offending tenant or tier; also verify that an emergency limit does not strand legitimate work. Test isolation at the data, cache, queue, authorization, and reporting layers. A system that protects one API route but leaks pressure through a shared worker pool is not tenant-safe.
Review the evidence as an operating decision
Present demand assumptions first, then correctness, service objectives, saturation, and recovery. Show distributions and tenant cohorts rather than one impressive average. Assign every failed threshold and unexplained anomaly to an owner with a next decision: fix code, change topology, set a product limit, add capacity, narrow scope, or stop release. The SaaS performance testing FAQ is useful for common questions, while the result pack should remain specific to the release under review.
Retain the scenario version, environment, dataset profile, thresholds, raw distributions, telemetry references, bottleneck analysis, tested safe range, and approval record. State when the evidence expires: a new tenant mix, dependency, region, database size, or demand forecast should trigger revalidation. Teams that need ongoing operating ownership can compare the SaaS development company delivery plan and keep the same evidence contract after handoff.
Key takeaways
- Test complete SaaS journeys and business effects, not only endpoint throughput.
- Represent tenant size, behavior, data skew, and contention so averages do not hide harm.
- Choose protocol, browser, hybrid, component, and end-to-end tests for explicit decisions.
- Define thresholds and abort rules before execution, including correctness assertions.
- Correlate traces, metrics, logs, queues, retries, and resource limits to explain bottlenecks.
- Treat recovery, isolation, headroom, and evidence expiry as readiness criteria.
Frequently asked questions
How often should a SaaS product run performance tests?
Run a focused regression set with material releases and schedule broader baseline tests as traffic, tenant mix, architecture, data volume, or major dependencies change. Repeat capacity and recovery tests when the forecast or service tier changes.
Should load tests run in production?
Only limited, low-risk checks should run in production, with explicit approval, monitoring, abort thresholds, test accounts, and incident ownership. Aggressive stress, spike, and failure tests belong in a controlled environment.
Which metric matters most?
No single metric is sufficient. Pair journey-level percentile latency with correctness, error rate, queue age, saturation, recovery, and tenant-cohort results. The right measure is the one that changes a release or capacity decision.
Do API tests replace browser performance tests?
No. Protocol tests scale efficiently and explain backend behavior; browser tests reveal rendering and interaction costs. Use both when user experience depends on the integrated path, with each test answering a distinct question.
Conclusion
SaaS performance testing is ready when the team can state what demand was represented, which customer outcomes had to remain correct, where the system saturated, how it recovered, and what decision followed. Tenant-aware workloads, predeclared thresholds, correlated evidence, and explicit ownership turn a load run into a durable release and capacity control.