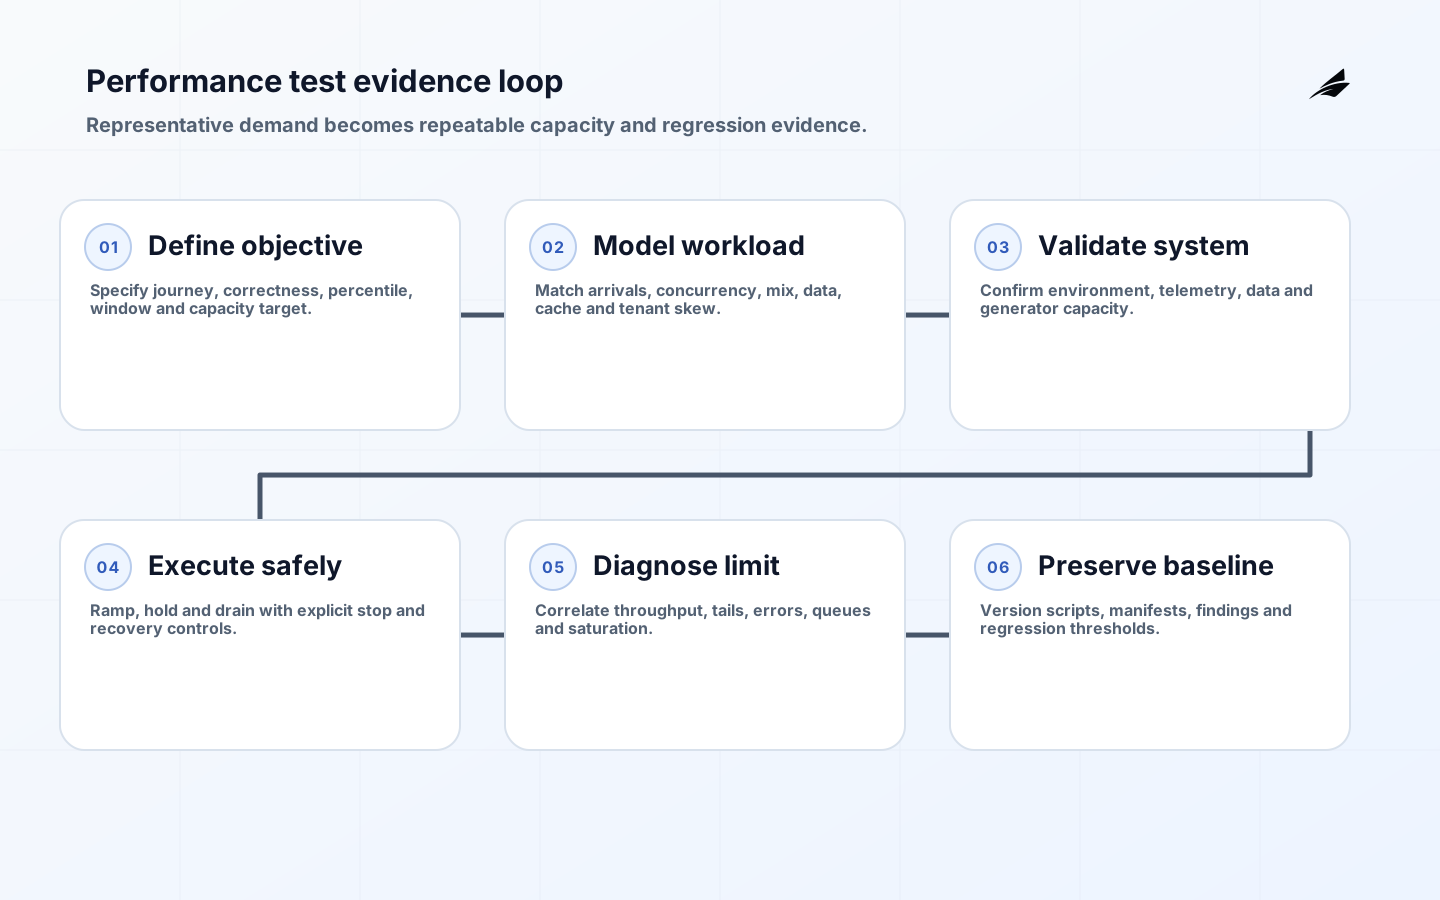
A performance testing services implementation checklist should produce a defensible relationship between workload and user outcome: under specified traffic, data, configuration and dependency conditions, the service meets latency, correctness and reliability objectives with known capacity and failure behavior. Generating requests is not the objective. A useful engagement models real journeys, validates the load generator, observes the whole system, identifies bottlenecks and leaves repeatable tests that can detect regression after architecture or traffic changes.
Use the performance testing FAQ for procurement questions and the SaaS managed performance testing plan for recurring service scope. Teams adopting a managed model can compare the managed performance checklist and managed service FAQ. This checklist requires owners on both provider and product teams because only the product owner can define representative use and acceptable risk.
Define user-facing objectives and scope
Choose a handful of service level indicators that users care about: successful transaction rate, end-to-end latency, throughput, freshness or durability. Specify the event, population, measurement point, percentile and window. Google SRE recommends working from desired user behavior backward to indicators and warns that averages hide tail latency. Include correctness: a fast response with stale price, duplicate order or missing write is a failure. Distinguish an internal SLO from an SLA with contractual consequences.
| Objective field | Example question | Required decision |
|---|---|---|
| Journey | Which completed action matters? | Exact start, end and success |
| Population | Which users, payloads and regions? | Included and excluded cohorts |
| Latency | Which percentile and measurement point? | Client or server threshold |
| Reliability | What errors count against success? | Status and domain correctness |
| Capacity | What peak and growth must be sustained? | Expected and breakpoint load |
Build a representative workload model
Derive traffic from production or credible forecasts: arrival rate, concurrency, session length, think time, journey mix, payload distribution, cacheability, tenant concentration, geographic origin and scheduled jobs. Preserve correlations such as browse followed by checkout instead of sampling endpoints independently. Model authenticated and anonymous paths, reads and writes, hot and cold keys, uploads, retries and background processing. Remove or synthesize personal data. Document uncertainty and create at least expected, peak, spike, sustained and breakpoint scenarios where relevant.
Use test types for distinct questions
Run a smoke test first to validate scripts and instrumentation. Use average-load tests for regression baselines, stress tests for expected maximum, spike tests for sudden change, soak tests for leaks and accumulation, and breakpoint tests to find capacity limits. Grafana k6 guidance recommends smoke and average tests before larger runs. Do not run every test on every commit; map frequency and environment cost to risk. A short stress test cannot reveal a connection leak that appears after hours.
Control the environment and test data
Record application version, infrastructure, autoscaling, database size, indexes, caches, feature flags, provider tiers, network path, observability settings and competing workloads. Production-like does not mean identical, but differences must be understood. Prevent accidental tests against production with allowlists and explicit approvals. Size load generators separately and monitor their CPU, memory, network and connection limits. Apache JMeter documentation advises CLI mode for load execution; GUI mode is for building and debugging plans. Distributed generators multiply the configured plan, so calculate total load explicitly.
| Validity risk | Control | Evidence |
|---|---|---|
| Generator saturation | Monitor injectors and distribute load | Injector utilization and achieved rate |
| Warm cache bias | Define warm-up and cold-cache scenario | Cache state and timeline |
| Unrealistic data | Match cardinality, size and skew | Dataset profile |
| Hidden dependency limit | Inventory quotas and provider behavior | Throttle and error telemetry |
| Configuration drift | Version environment and flags | Run manifest |
Instrument the complete request path
Collect client timing, service metrics, traces, logs, database plans, queue depth, runtime pauses and infrastructure saturation. OpenTelemetry can correlate metrics, logs and traces across services, but avoid high-cardinality or sensitive attributes. Synchronize clocks and attach a test-run identifier. Measure dependency latency and retries so the test distinguishes application work from provider behavior. Observe business outcomes and data integrity after the run. Instrumentation overhead should be measured; disabling all telemetry creates an unrealistic system that cannot explain failure.
For browser journeys, combine laboratory tests with field data. Core Web Vitals evaluate LCP, INP and CLS at the 75th percentile with published “good” thresholds, but they do not replace product-specific completion measures or backend capacity tests. Segment device and network classes. A backend can meet server latency while JavaScript, third-party tags or rendering make the customer experience slow. Conversely, a fast initial page can hide a delayed asynchronous transaction.
Execute safely with explicit stop conditions
- Validate scripts, test accounts, data reset, telemetry and generator capacity with smoke load.
- Warm the system according to the documented scenario and capture a stable baseline.
- Ramp at the planned rate while comparing achieved load with the requested model.
- Stop on safety thresholds for errors, data damage, provider limits or shared-environment impact.
- Hold the target duration, then ramp down and allow delayed work to drain.
- Reconcile business records, preserve the run manifest and classify bottlenecks before retesting.
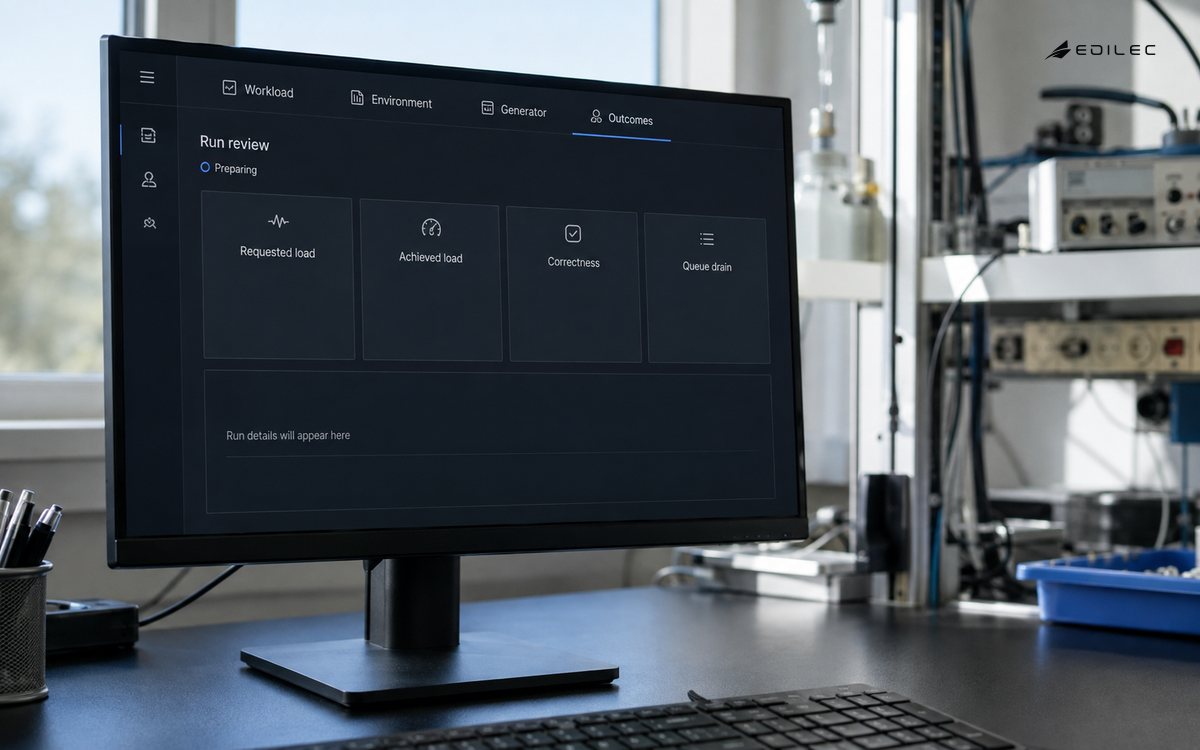
Coordinate with operations, security, vendors and dependent teams. Define start and stop authority, communication channel and recovery steps. Rate-limit destructive paths and ensure test messages, payments or notifications cannot reach real customers. Watch queue accumulation after generators stop. A test that ends while asynchronous work is still failing understates impact. Avoid changing several variables during a run; otherwise cause and effect become ambiguous. Retest one hypothesis at a time and compare against the same baseline.
Analyze bottlenecks and capacity evidence
Plot offered load, achieved throughput, success rate and latency percentiles on one timeline. Find where throughput stops increasing, latency bends upward or errors begin. Correlate that point with saturation, lock contention, queue growth, garbage collection, connection pools, database plans and dependency throttling. Do not infer causation from one correlated chart. Form a hypothesis, change one constraint and rerun. Report capacity as a range under the stated configuration and workload, with safety margin and known limits, not as a permanent maximum.
Turn the engagement into a regression system
Store scripts, datasets, thresholds and environment manifests in version control. Run small deterministic checks in delivery pipelines and schedule larger tests around high-risk releases or capacity reviews. Trend results only when workload and environment are comparable. Assign ownership for failed thresholds and flaky scripts. Update models when traffic, features, providers or architecture change. Google SRE recommends using load testing rather than tradition to establish resource-to-capacity ratios; yesterday’s result may no longer describe today’s software.
Require useful service deliverables
A performance testing provider should hand over the workload model, scripts, data-generation method, environment manifest, runbook, raw results, dashboards, findings, hypotheses, retest evidence, capacity statement and known limitations. Scripts need readable parameterization and secret handling, not provider-only credentials. The report should distinguish observed fact from inference and connect every recommendation to evidence. Require timestamps and run identifiers so product telemetry can be correlated independently. A screenshot without query, threshold or configuration cannot support a future comparison.
Review the provider’s safety model before granting access: test target controls, production approvals, data handling, generator regions, source addresses, cloud cost, incident communication and cleanup. Confirm protocol and journey support rather than assuming an HTTP tool can model browsers, streaming, queues or proprietary clients faithfully. Ask how the provider validates its own generators and detects coordinated omission. Acceptance should include a joint reproduction of one run and a product-team walkthrough of one bottleneck investigation.
Convert results into a capacity plan
Translate the sustainable tested rate into forecast headroom using expected growth, seasonal peaks, failover capacity and deployment behavior. State whether redundancy was impaired during the run; a cluster may meet peak only while every instance is healthy. Connect scaling thresholds to leading saturation and queue signals, then verify scale-out time under load. Include provider quotas, database connections, partition limits and downstream contracts. Revisit the plan after significant code, data, topology or traffic-mix changes instead of extrapolating indefinitely.
Capacity decisions should include cost and graceful degradation. Identify optional work that can be delayed or disabled while core transactions remain correct. Test admission control and backpressure so overload does not become a cascading failure. Estimate unit cost at expected and peak load, including observability and generator expense. A faster architecture is not automatically better if it multiplies cost without improving a user objective. Record the selected margin and the business owner who accepted the remaining risk.
Key takeaways
- Start from user journeys, correctness and explicit service objectives.
- Model arrival, concurrency, data, cache and tenant behavior realistically.
- Validate generators and environment before trusting results.
- Correlate end-to-end outcomes with resource and dependency evidence.
- Version tests and refresh capacity assumptions as the system changes.
Frequently asked questions
Should performance tests run in production?
Small controlled probes and resilience exercises can be valuable in production when approved, isolated and reversible. High-load or destructive tests usually belong in a representative environment unless the organization has mature safeguards. Never surprise shared users or providers. Define data, cost, communication and stop controls before any production exercise.
How many virtual users should we test?
Virtual-user count alone is not a workload. Derive concurrency from arrival rate, journey duration and think time, or use an arrival-rate model directly. Match journey mix and payloads. Report achieved throughput and concurrency because a saturated generator may fail to produce the requested load. Test expected peak plus an agreed margin and a separate breakpoint scenario.
What is a performance test pass?
All defined journey, correctness, latency, error and resource thresholds hold for the required duration; delayed work drains within target; records reconcile; no safety limit is breached; and the generator produced the intended workload. A single average response time or attractive dashboard is not sufficient. Preserve configuration and evidence so the result can be reproduced.
Conclusion
Performance testing services create value when they turn representative demand into repeatable evidence about user experience, capacity and failure. Define SLOs, model real work, control the environment, instrument the full path and reconcile outcomes after load stops. The deliverable is not a one-time chart; it is a trustworthy test system and a set of limits that engineering and operations can use for the next release and capacity decision.