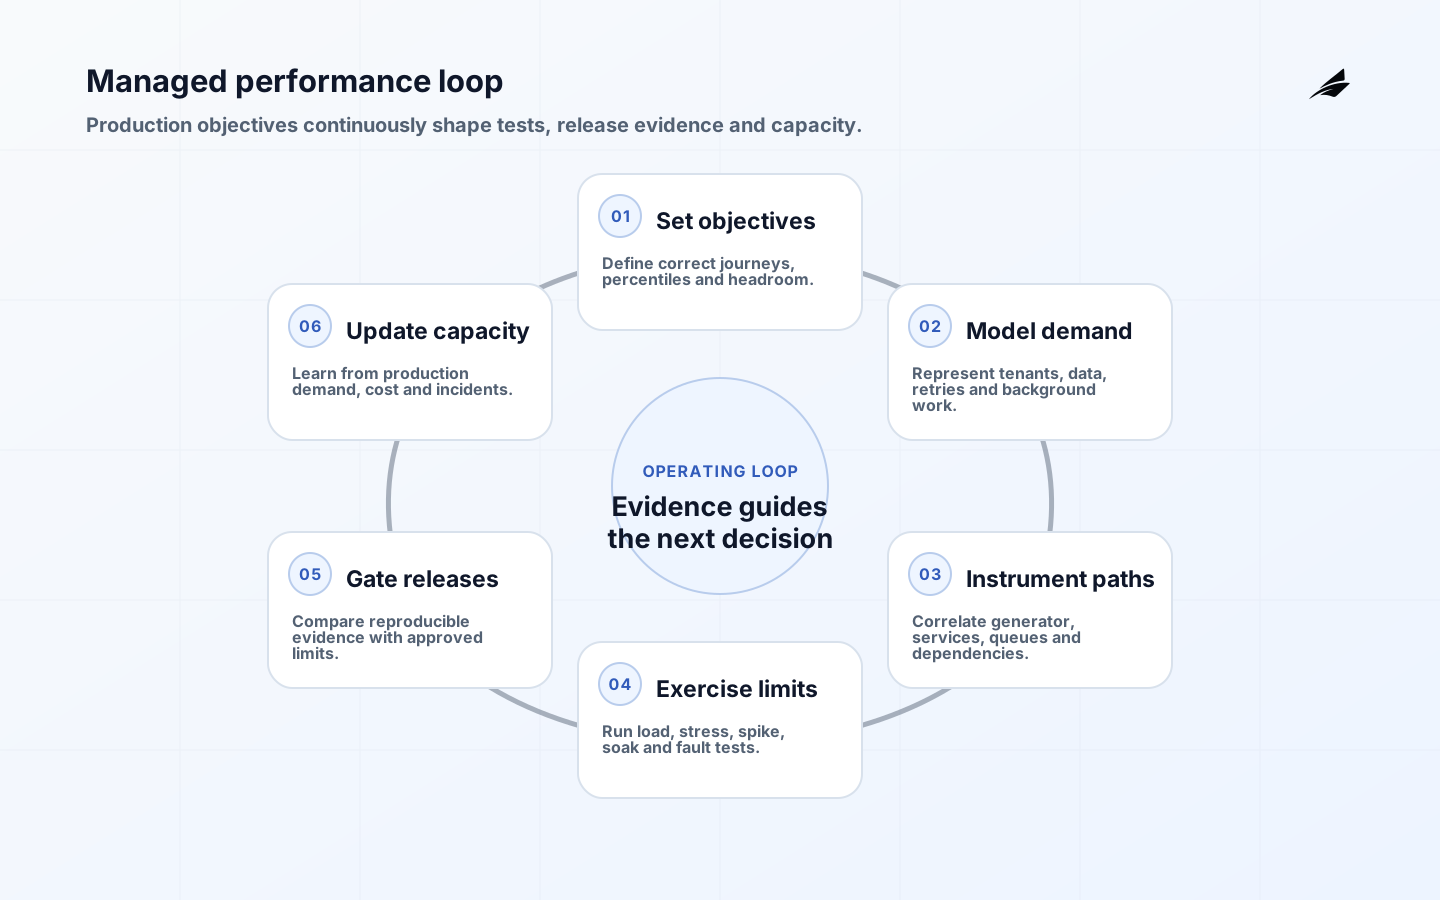
Performance testing for SaaS managed services should answer a business question: can the service deliver correct user outcomes for representative tenants at expected and exceptional demand, with enough headroom and recovery capacity to meet its commitments? It is not a one-time request-rate demonstration. A useful managed service maintains workload models, test code, environments, telemetry, release criteria and capacity evidence as the product changes. This implementation checklist helps product, platform, SRE, QA and provider teams establish that operating capability.
Use this checklist with Edilec's managed performance testing delivery plan, managed service FAQ and SaaS performance testing checklist. Agree scope before buying tools or test volume. The provider can run and analyze tests, but product owners still own customer objectives and engineering owners still own remediation and release decisions.
1. Define user objectives and release thresholds
Identify critical journeys such as sign-in, search, checkout, report generation, ingestion, export and scheduled processing. For each, define the population, successful result, latency distribution, throughput, freshness or completion window and allowed error. The Google SRE guidance on service level objectives distinguishes indicators, objectives and contractual agreements. Apply that discipline: state exactly how an indicator is calculated, over what window and with which exclusions. Use percentiles for user latency and include correctness; a fast error is not success.
Translate objectives into test thresholds without pretending a laboratory is production. Define maximum steady demand, burst shape, tenant mix and minimum headroom. Include resource, dependency and cost guardrails. A release may pass response-time thresholds while doubling database spend or saturating a queue that fails after the test ends. Establish warning and failure bands, who can accept an exception, its expiry and the evidence required for retest. Keep exploratory diagnosis separate from a reproducible release gate.
| Objective | Test indicator | Example release evidence |
|---|---|---|
| Interactive speed | Successful journey latency percentiles | p50, p95 and p99 under target tenant mix |
| Capacity | Sustained correct throughput | Stable queues and resources with headroom |
| Batch freshness | Completion age at peak overlap | All priority jobs finish inside window |
| Resilience | Degraded success during dependency fault | Bounded errors and recovery without data loss |
| Efficiency | Cost per successful business unit | Spend remains inside agreed guardrail |
2. Build a tenant-aware workload model
Derive workload from production telemetry and product forecasts. Model journey proportions, think time, session duration, payload size, data age, tenant size, permission shape, geographic distribution, scheduled jobs, retries and background integrations. Separate arrival rate from virtual-user count; an open arrival model is often better for externally driven demand because a slowing system should not automatically reduce attempted work. Preserve realistic correlation: a checkout follows a cart, an export reads accumulated data and a retry follows a particular failure.
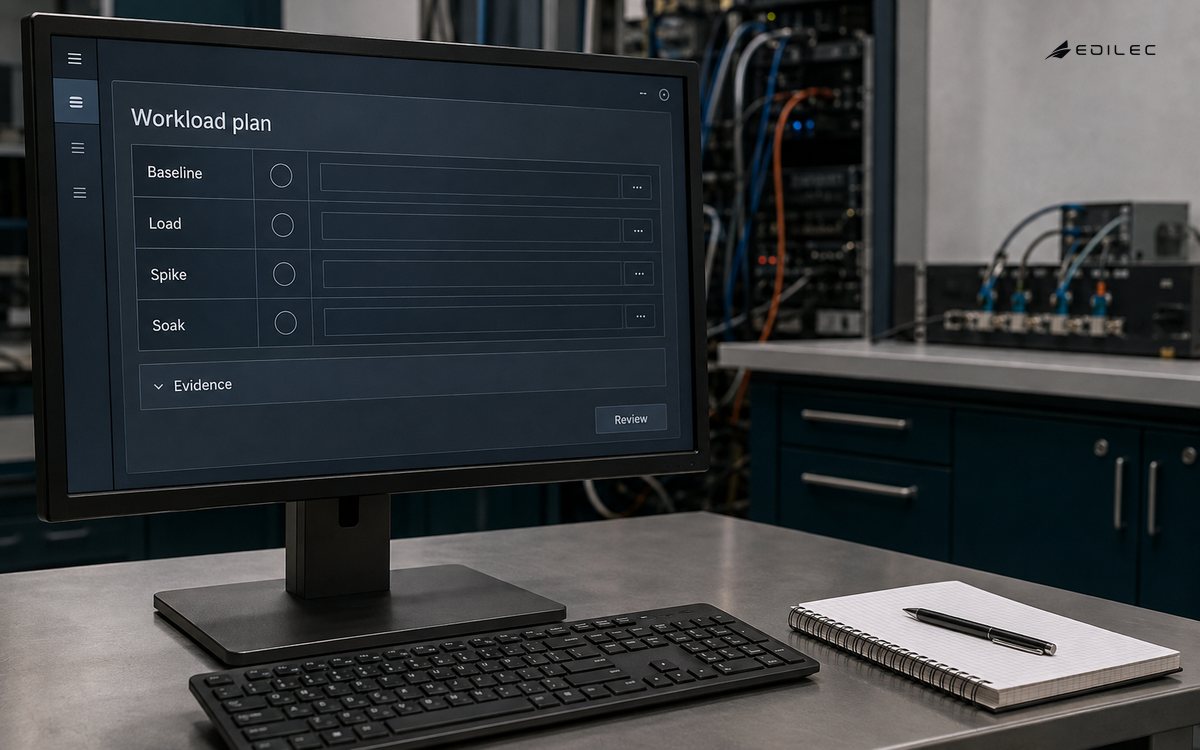
Represent multi-tenant skew explicitly. Test many small tenants, a few large tenants and a concentrated noisy neighbor. Verify per-tenant quotas, fair scheduling and isolation rather than relying on global averages. Seed data with realistic distributions and indexing characteristics; repeating one customer and one query can produce misleading cache behavior. Protect personal and confidential data by generating or masking fixtures. Version the dataset with the scripts so regression comparisons use a known state.
3. Instrument the complete path and capture a baseline
Observe the load generator, edge, application, queues, data stores, caches and external dependencies. The OpenTelemetry signals model provides a vendor-neutral basis for traces, metrics and logs. Propagate correlation context so a slow journey can be attributed across services. Record saturation indicators such as connection pools, worker concurrency, queue age, storage latency and throttling. Keep metric labels bounded; tenant IDs and raw paths can create excessive cardinality and cost.
Run a low-load baseline before a large test. Confirm that checks represent business success, generator resources are not saturated, timestamps align and telemetry is complete. Measure natural variability over several repetitions. Tag every run with application build, infrastructure and configuration versions, dataset, script commit, environment and provider limits. Without that provenance, a comparison is anecdotal. The Google SRE monitoring guidance recommends focusing on latency, traffic, errors and saturation; add product and tenant measures needed to explain customer impact.
4. Run a proportionate portfolio of tests
Use different tests for different questions. A smoke test validates scripts and checks. A load test verifies expected demand. Stress finds the capacity knee and failure behavior. Spike tests sudden arrival, soak tests leaks and accumulated work, and resilience tests dependency or resource loss. The Grafana k6 documentation describes spike, stress and soak use cases, but tool choice is secondary to a valid workload and observable system. Add component tests when end-to-end results cannot isolate a bottleneck.
Control test risk. Approve targets and time windows, prevent accidental production execution, notify dependency owners and set spend limits. Warm or cold caches deliberately and label the condition. Avoid coordinated omission by using an arrival model and record attempted work. Let soak tests run long enough to expose queue accumulation, memory growth, connection leaks, storage expansion and credential expiry. After stress, verify graceful rejection and recovery; a system that reaches high throughput but requires manual repair has not demonstrated acceptable capacity.
| Test type | Question answered | Typical stop condition |
|---|---|---|
| Smoke | Are scripts, checks and telemetry valid? | Any incorrect result or missing signal |
| Load | Does expected demand meet objectives? | SLO or resource guardrail breach |
| Stress | Where is the capacity knee? | Unsafe saturation or uncontrolled error |
| Spike | Can sudden demand be absorbed? | Queue age or recovery exceeds limit |
| Soak | Does performance decay over time? | Leak, backlog or cost trend exceeds bound |
| Resilience | Does a fault remain contained? | Data loss, broad outage or failed recovery |
5. Operate the managed testing service
Define the provider boundary in a service catalogue. Include journey modeling, script maintenance, fixture preparation, environment checks, execution, analysis, reporting, retest and capacity review. Name customer duties for forecasts, release notices, credentials, data, architecture changes and remediation. Establish access controls and retention for test data and results. The provider should return scripts and raw evidence in portable form, not only a dashboard. Require peer review for material workload changes and disclose subcontracted infrastructure.
Schedule recurring baseline, release and capacity runs based on change risk. Trigger additional testing for database changes, new tenant tiers, region moves, major integrations, runtime upgrades and demand events. Keep a triage path from failed threshold to trace, resource, query and code evidence. Findings should identify reproducibility, customer effect and likely constraint without overstating certainty. Track remediation through retest. AWS's Performance Efficiency guidance includes load testing and regular metric review as continuing practices, which is the right posture for a managed service.
6. Gate releases and learn from production
Automate a stable subset in delivery pipelines and reserve larger or destructive tests for controlled environments. A gate should compare approved indicators with a versioned baseline and explain failure. Do not fail on noisy single samples; use repeated measurements or tolerance bands while keeping hard correctness limits. Require an owner and expiry for waivers. Publish capacity assumptions alongside release approval so commercial and operations teams know the supported tenant and demand envelope.
After release, compare real journey distributions, tenant mix, retries, queue behavior and resource cost with the test. Update scripts when production disproves assumptions. Review near misses and incidents for missing scenarios. Capacity planning should combine demonstrated throughput, forecast uncertainty, failover needs and provisioning lead time. Keep enough reserve to survive a zone or dependency impairment where required. Retire obsolete scripts and metrics; a sprawling suite that no one trusts is not an assurance system.
Manage environment fidelity explicitly. A smaller test environment can still provide useful regression evidence if scale ratios, service limits and known differences are documented. It cannot prove production capacity by simple multiplication when databases, caches, networks or managed services scale nonlinearly. Periodically compare a safe production observation with the test environment to quantify bias. Reserve representative capacity windows and prevent unrelated teams from changing the environment during a governed run.
The managed service should also maintain a constraint register. For each known bottleneck, record the triggering workload, affected journeys and tenants, temporary guardrail, remediation option and retest. Recheck it when demand or architecture changes. This turns a report into capacity knowledge and prevents teams from repeatedly rediscovering the same limit. Close a constraint only after the new threshold is demonstrated and production monitoring can detect approach to it.
Review provider performance using service outcomes rather than test volume. Useful measures include script freshness, reproducible-run rate, time from finding to diagnosis, retest latency, escaped capacity incidents and percentage of critical journeys covered by current evidence. Penalizing the provider for finding failures creates the wrong incentive; reward timely, accurate evidence and successful collaboration on remediation.
Key takeaways
- Start with successful user journeys, percentiles, correctness and capacity headroom.
- Model tenant skew, background work, realistic data and retries.
- Instrument generator, application and dependencies before increasing load.
- Use load, stress, spike, soak and resilience tests for distinct questions.
- Require portable scripts, raw evidence, remediation ownership and production feedback from the provider.
Frequently asked questions
Can testing use production? Small controlled probes may be appropriate, but disruptive tests need explicit approval and safeguards. How often should a SaaS be load tested? Run focused gates on material change and broader capacity tests on a risk-based cadence. Is average response time useful? It hides slow-tail experience; report percentiles and correctness. Who owns a failed test? The service owner owns the release decision, while engineering owners fix constraints and the provider supplies reproducible evidence. How much headroom is enough? It depends on forecast uncertainty, failover demand and scaling lead time; document the assumption rather than using a universal percentage.
Conclusion
A managed performance testing service is valuable when it maintains a credible model of the SaaS product, not when it merely generates traffic. Connect user objectives to tenant-aware workloads, correlated telemetry, purposeful tests and explicit release evidence. Then use production behavior to correct the model. That loop turns performance testing from a late project event into an operational capacity and reliability control.