Observability and monitoring setup is the operating layer that lets a team understand whether a product is healthy, why it is failing and what should happen next. A useful setup does more than collect graphs. It connects application behavior, infrastructure health, user impact, alert routing and post-incident learning into one readable system.
This guide is written for business and engineering teams planning production software, cloud platforms or internal systems. It can support a new build through Cloud and DevOps services or help repair an existing monitoring stack that has become noisy, fragmented or ignored.
What observability should answer
A monitoring project should start with the questions the team needs to answer during normal operation and during an incident. If the dashboard cannot help someone decide whether customers are affected, which service owns the issue and what recovery step is next, it is not yet an operating tool.
- User impact: Are customers seeing errors, slow responses, failed jobs or missing data?
- System boundary: Which service, queue, database, API or cloud resource is closest to the symptom?
- Change context: Did a deployment, feature flag, configuration change or traffic pattern shift before the issue started?
- Ownership: Which team owns the alert, runbook, escalation path and follow-up action?
- Learning loop: What will be changed after the incident so the same failure is easier to prevent or diagnose next time?
Signals to collect and why they matter
The OpenTelemetry signals documentation describes the core telemetry signals that modern teams use to observe systems: traces, metrics, logs and baggage, with profiles also developing as a resource-usage signal. In practical terms, each signal answers a different question.
| Signal | What it tells you | Useful examples |
|---|---|---|
| Metrics | A numeric measurement captured over time. | Request latency, error rate, queue depth, CPU, memory, database connections. |
| Logs | A record of events and context. | Validation errors, payment failures, worker retries, security-relevant actions. |
| Traces | The path of a request through services. | Slow checkout flow, API fan-out, dependency bottlenecks, timeout chains. |
| Events and profiles | Specific activity or resource usage details. | Deployments, feature flag changes, CPU hotspots, memory-heavy code paths. |
Use golden signals and SLOs to reduce dashboard sprawl
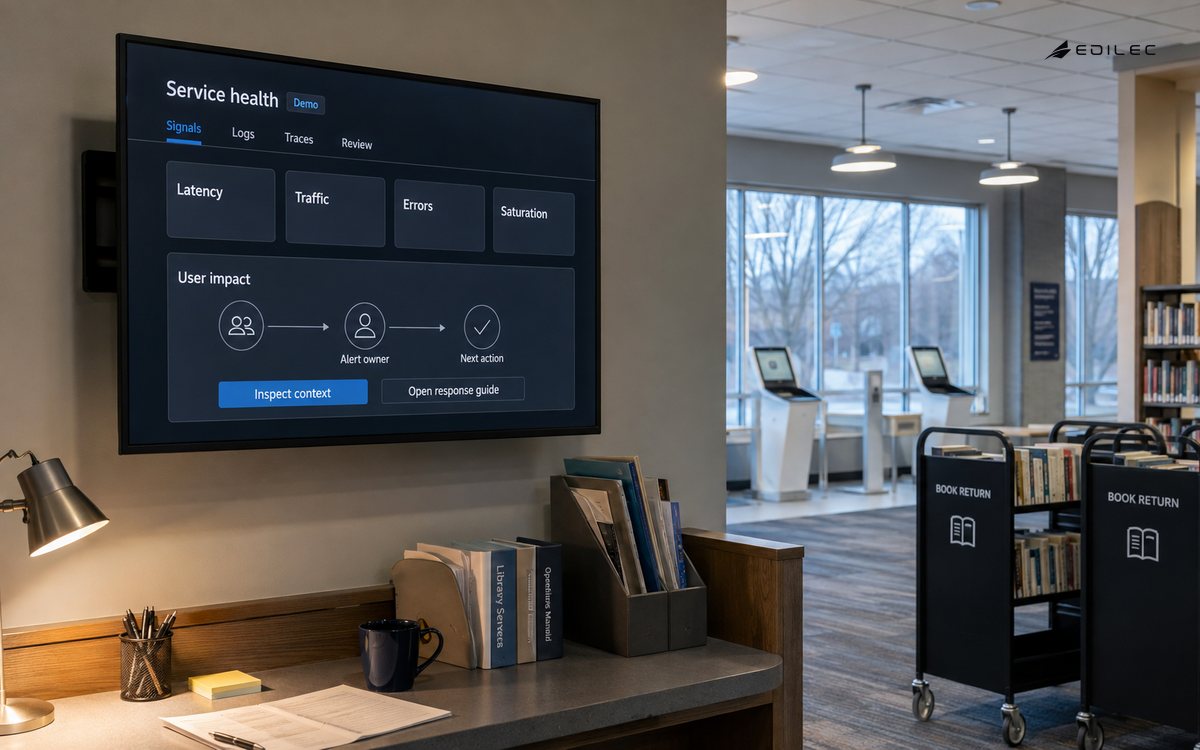
The Google SRE book recommends the four golden signals of monitoring for user-facing systems: latency, traffic, errors and saturation. They are not the only measurements a team needs, but they are a strong starting point because they stay close to user impact.
A production-ready setup should translate those signals into service-level objectives where the business depends on reliability. For example, an order API may track successful request rate, p95 latency, failed payment callbacks and queue delay. A data pipeline may track freshness, failed runs and data-quality checks. The objective is not to count everything. It is to make the few important health questions easy to see.
A practical architecture to build
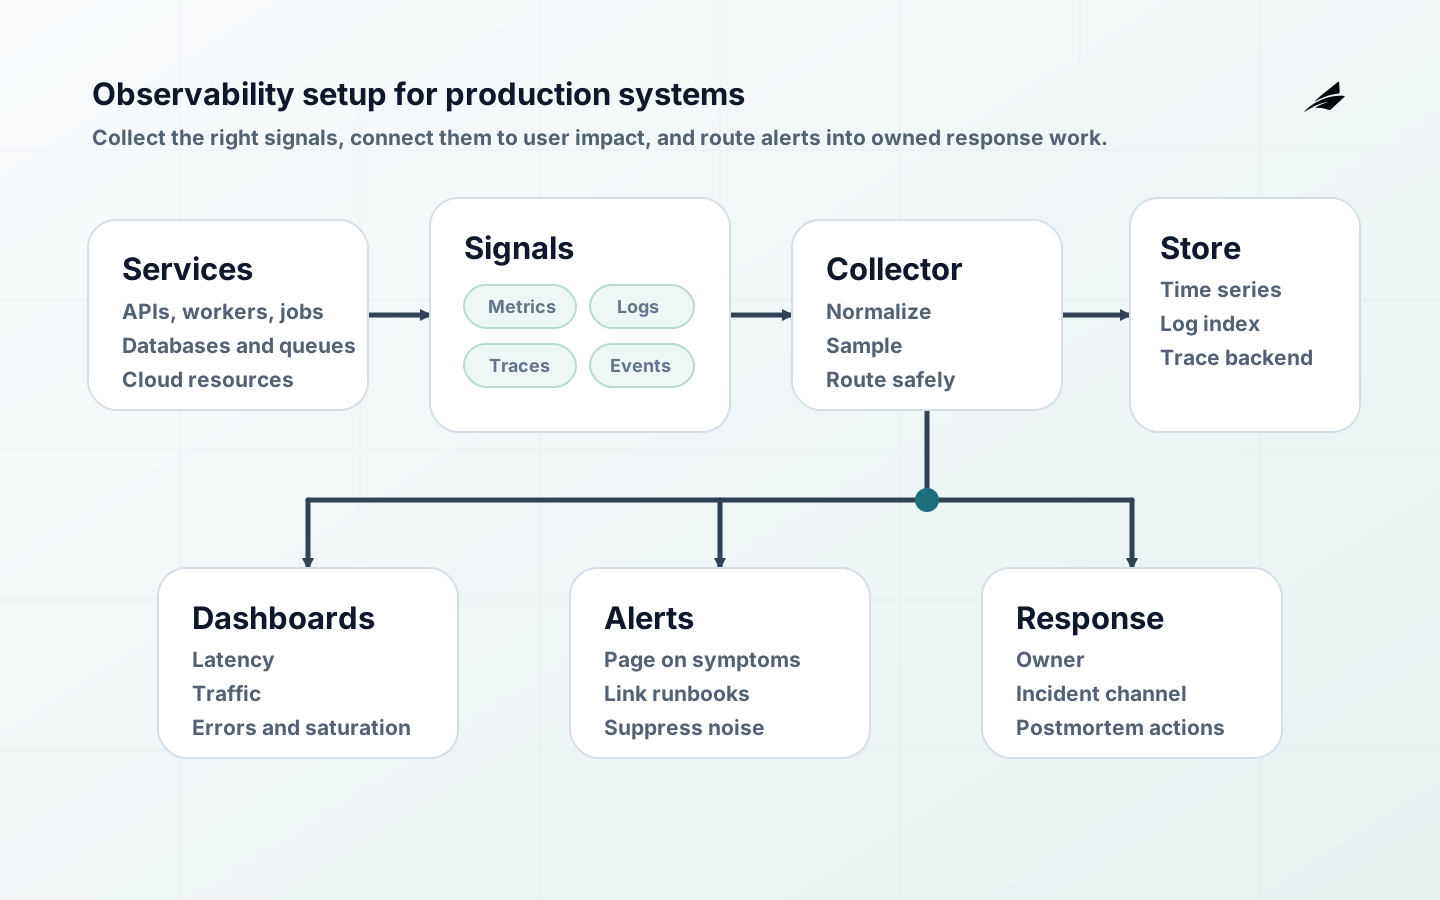
A maintainable observability architecture usually has five layers: instrumentation in the application, a collection and routing layer, storage backends, dashboards and alerting, then an incident workflow. The exact tools can change, but the ownership model should be explicit.
| Layer | Decision to make | Output |
|---|---|---|
| Instrumentation | Which services, jobs and dependencies emit metrics, logs and traces? | A telemetry plan for critical paths. |
| Collection | Will telemetry flow through OpenTelemetry Collector, cloud-native agents or vendor SDKs? | Consistent routing, sampling and enrichment. |
| Storage | Where are metrics, logs and traces retained, and for how long? | Cost-aware retention and searchable history. |
| Dashboards | Which dashboards answer executive, product, engineering and support questions? | Role-specific views instead of one giant wall of charts. |
| Alerting | Which symptoms page humans, and which issues create tickets or reports? | Lower noise and clearer incident ownership. |
Design alerts that people trust
Alert fatigue is usually a design problem. Prometheus recommends keeping alerting simple, alerting on symptoms and avoiding pages where there is nothing actionable to do. That guidance is especially important for small teams because every noisy alert teaches people to distrust the system.
- Page humans only for urgent, user-impacting or soon-to-be-user-impacting symptoms.
- Attach the dashboard, runbook, service owner and recent-change view to every critical alert.
- Use ticket alerts for slower risks such as capacity planning, data drift or non-critical batch failures.
- Monitor the monitoring stack itself so a failed alerting path does not create false confidence.
- Review noisy alerts during incident retrospectives and monthly operations reviews.
Implementation checklist
- Inventory the services, background jobs, databases, queues, external APIs and cloud resources that matter to customer or operational outcomes.
- Define the top workflows to observe first: signup, checkout, document intake, reporting, approval routing, payment, support or production release.
- Create a telemetry naming and attribute convention before adding instrumentation at scale.
- Connect deployment events, feature flags and configuration changes to incident timelines.
- Document dashboard ownership, alert severity, escalation rules and runbook locations.
- Test the alert path with a controlled failure before the system is considered production-ready.
Instrument the critical path first
A team does not need to instrument every component at the same depth on day one. Start with the business flow whose failure creates the clearest customer, revenue or operational impact. Trace that flow across the services and dependencies it uses, then add supporting infrastructure signals. The OpenTelemetry Demo is useful because it shows instrumentation in a realistic microservice system rather than as isolated code snippets.
| Priority | Start with | Evidence that the layer is ready |
|---|---|---|
| 1. User journey | One critical path such as signup, checkout, document intake or approval. | A synthetic or real-user check shows success, latency and failure state. |
| 2. Service boundary | The APIs, workers and queues that execute the journey. | Metrics and traces identify the service closest to a symptom. |
| 3. Data dependency | Databases, caches, object stores and third-party APIs. | Dashboards expose saturation, timeout, error and freshness signals. |
| 4. Change context | Deployments, feature flags and configuration changes. | An incident timeline shows what changed before impact began. |
| 5. Response path | Alert routing, on-call ownership and runbooks. | A controlled drill reaches the correct person with usable context. |
A 90-day observability rollout
| Period | Delivery focus | Review gate |
|---|---|---|
| Days 1-30 | Inventory critical workflows, define service owners, instrument one user journey and agree on telemetry conventions. | The team can follow one request end to end and identify user impact. |
| Days 31-60 | Create service-health and business-flow dashboards, connect change events and establish severity-based alert routing. | Alerts are actionable, owned and linked to the relevant dashboard and runbook. |
| Days 61-90 | Define SLOs, test failure scenarios, tune retention and sampling, then review cost and alert quality. | Operations can detect, diagnose and rehearse recovery without relying on private knowledge. |
Protect telemetry quality and sensitive data
Telemetry is production data. Logs and traces can accidentally capture customer identifiers, tokens, document contents or payment details. Define an attribute allowlist, redact secrets before export, restrict access by role and set retention by investigative need. At the same time, monitor dropped spans, collector queue pressure, sampling changes and export failures so the team knows when the evidence itself is incomplete.
Common failure modes to avoid
| Failure mode | Why it hurts | How to prevent it |
|---|---|---|
| Tool-first monitoring | The team buys a platform but never defines the questions it must answer. | Start with user journeys, service ownership and incident decisions. |
| Too many alerts | Engineers learn to mute or ignore the system. | Page only on user-impacting symptoms and route lower-severity issues to tickets. |
| No change context | Incidents take longer because deploys and configuration changes are invisible. | Attach releases, feature flags and config updates to dashboards and timelines. |
| No data retention plan | Logs or traces disappear before an incident review is complete, or storage cost grows without control. | Set retention by signal type, criticality and investigation need. |
| No owner | Dashboards age, alerts drift and nobody improves the setup after incidents. | Assign service owners and review observability during operational reviews. |
Key takeaways
- Start with user journeys, service ownership and the incidents the team must be able to explain.
- Collect metrics, logs and traces with consistent service and release context.
- Use SLOs and symptom-based alerts to protect users without creating alert fatigue.
- Treat dashboards, retention, privacy and escalation paths as owned production assets.
- Exercise detection and recovery before expanding the monitoring footprint.
Frequently asked questions
| Question | Practical answer |
|---|---|
| Is observability different from monitoring? | Monitoring tells you when known symptoms happen. Observability helps you understand new or unexpected behavior by combining telemetry, context and investigation paths. |
| Should a small team use OpenTelemetry? | Often yes, especially if the product may change vendors or cloud providers. OpenTelemetry can standardize telemetry before the team commits to one backend. |
| How many dashboards should we start with? | Start with one service-health dashboard, one business-flow dashboard and one incident view. Add more only when a team has a clear owner and decision for the view. |
| What should be measured after launch? | Track incident count, mean time to detect, mean time to restore, alert noise, dashboard usage and the number of failures found before customers report them. |
Conclusion
A good observability and monitoring setup makes production less mysterious. It gives teams faster detection, cleaner ownership, better post-incident learning and stronger confidence when releases move quickly. The best stack is not the one with the most charts. It is the one that helps the right person understand the right symptom in time to protect users.