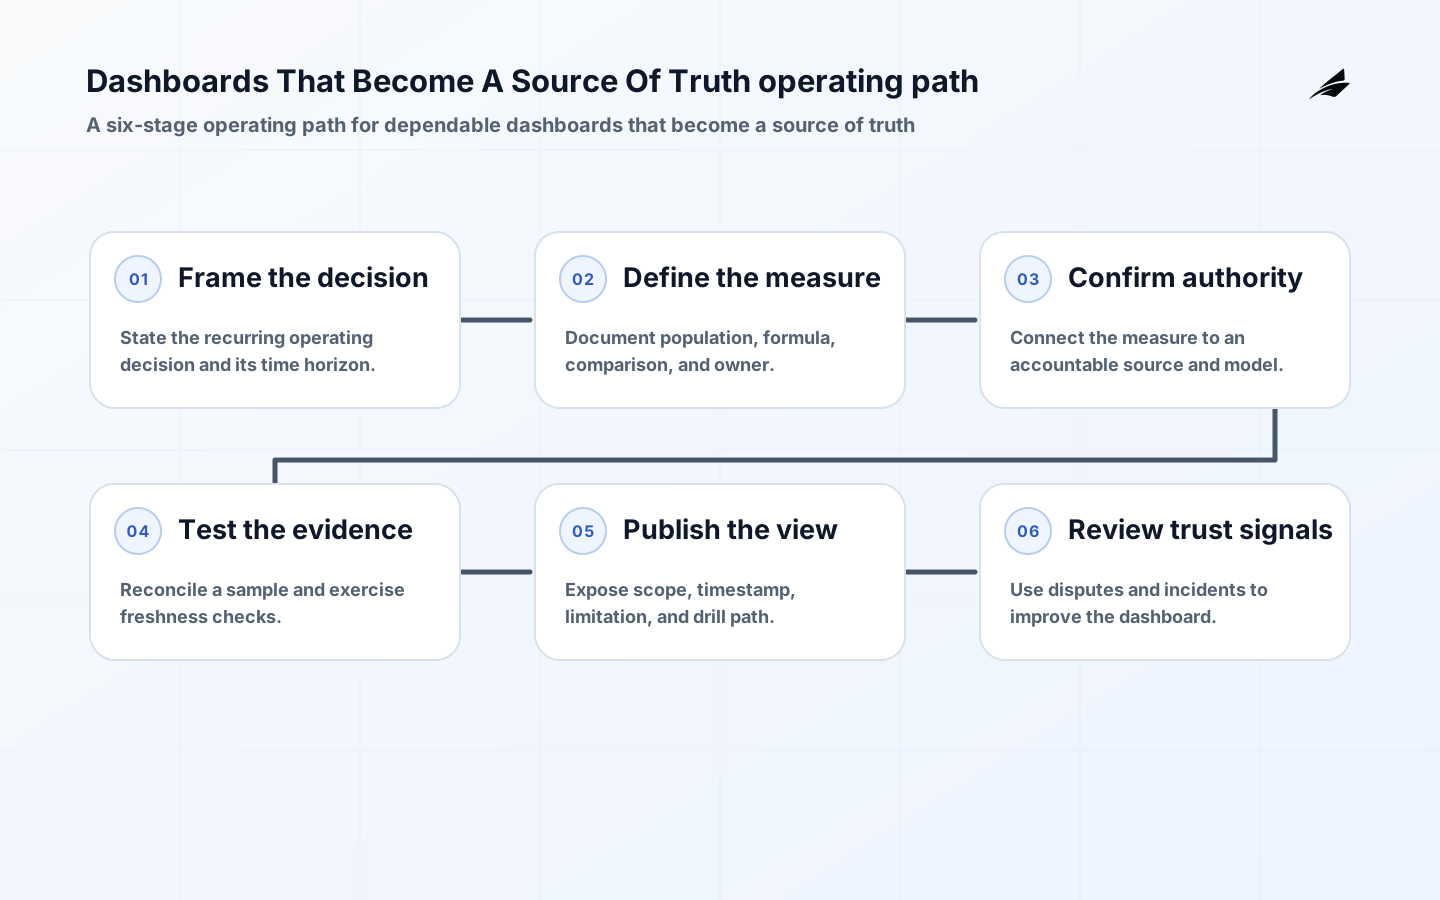
Dashboards That Become a Source of Truth: A Practical Operating Guide starts with a practical question: can leaders and analysts who need to make recurring operating decisions use a trusted operational dashboard to decide whether a dashboard should change a priority, trigger an investigation, or simply provide context without reconstructing the number in a spreadsheet or asking for private context? The answer depends less on how many charts or automated steps exist than on whether the reader can inspect meaning, scope, timing, and responsibility. Dashboards That Become A Source Of Truth is useful when it connects a stated decision to evidence that is current enough for that decision, and when it makes uncertainty visible instead of quietly averaging it away. This guide focuses on the operating choices that make the result explainable in routine work and defensible when a result is challenged.
Start with the decision dashboards that become a source of truth must support
Describe the work moment before designing the data product. For this subject, the relevant decision is whether a dashboard should change a priority, trigger an investigation, or simply provide context. Ask the people who take that decision which record they inspect first, what would make them wait, and what response follows a material change. Their answers establish a decision horizon, a tolerable freshness window, and the detail needed to investigate. A weekly planning discussion has different needs from an intraday exception queue. Treating both as the same reporting requirement usually creates a crowded interface and an ambiguous service level. A compact decision statement also provides a useful scope boundary: every field, transformation, and visual should improve the action, the explanation, or the recovery path.
- Write the decision in one sentence before naming visuals.
- Name a business owner and a technical steward for each material metric.
- Keep the denominator and the included population visible in the definition.
- Show the current publication time beside time-sensitive results.
Make evidence inspectable in dashboards that become a source of truth
The working evidence for dashboards that become a source of truth is metric definitions, governed semantic models, source ownership, refresh status, and a traceable route to the contributing records. Put this information where a reader can use it, not only in a handover document. State what one row or event represents, distinguish business time from load and publication time, and preserve identifiers that make a published result traceable. A source can be authoritative for one question but not for every question; document that boundary. Where records are matched across systems, make the matching rule, ambiguity handling, and effective date reviewable. This is especially important when a summary combines events, snapshots, or manual corrections, because an unnoticed one-to-many join can produce a credible-looking but wrong total.
| Element | Question to settle | Evidence to retain |
|---|---|---|
| Decision | What should the operating group decide or investigate? | A named decision and a time horizon. |
| Metric definition | What population, formula, exclusions, and comparison apply? | A versioned definition with an accountable owner. |
| Authority | Which system or model is authoritative for this use? | A source record and lineage path. |
| Freshness | When was the usable result produced? | A visible timestamp and threshold. |
Design controls and exceptions before publication
The central risk is that a visually polished report can be treated as authoritative even when two teams calculate the same measure differently. Controls should therefore test a specific promise, not merely confirm that software completed a run. Check source arrival against the decision window, validate required fields and permitted values, and reconcile material totals with their accountable record. Define what happens for each severity: a low-impact issue may call for a visible warning, whereas an issue that changes a commitment, priority, or externally used result should hold the measure or report. Every condition needs an owner, a response route, and a record of disposition. The Microsoft governance guidance similarly emphasizes ownership, documented policies, and controls that fit normal work rather than creating an opaque gate.
- Test a familiar result with the people who challenge it today.
- Run an empty, late, and duplicated-input scenario before broad release.
- Keep drill paths close to the headline rather than duplicating charts.
- Record the owner and response time for a failed control.
A controlled operating path for dashboards that become a source of truth
Build the first release around a narrow pilot in the meeting where the dashboard will actually be used. Use representative records, including an uncomfortable edge case, to test the definitions and the handoffs. Confirm that readers have only the access they need, that a resolver can see enough detail to act, and that a failed check is understandable outside the delivery team. Quality checks work best when they sit close to the transformation or publication step they protect; dbt data tests is a useful technical reference for treating assertions as executable checks. Release notes should identify changed meaning, affected history, and any limitation that a reader needs to carry into a decision.

| Situation | What to check | Expected response |
|---|---|---|
| Definition changes | Compare the old and proposed meaning with worked records. | Approve, version, and explain the impact before release. |
| Late source data | Show the affected period and freshness status. | Warn or hold the affected measure according to its decision risk. |
| Reconciliation variance | Tie a material total to its accountable source. | Investigate before representing the figure as final. |
| Access question | Confirm role, sensitivity, and business purpose. | Use a governed request path rather than an exported copy. |
Operate dashboards that become a source of truth as a maintained service
A release is not evidence that the service is dependable. Monitor metric disputes, unexplained changes, stale publications, and work that still escapes to private spreadsheets. Review a small sample of results with the domain owner and compare the published value with the source evidence, especially after a change in process, policy, or instrumentation. Separate a data defect from a legitimate change in the business; both matter, but their remedies differ. Keep a lightweight log of questions and incidents so recurring ambiguity becomes a definition, model, or workflow improvement rather than another local workaround. The NIST Data Governance and Management Profile work is useful context here: governance is an organizational practice that connects data management choices to accountable risk decisions.
Implementation choices that protect the decision
Choose tooling after the decision contract is clear. A warehouse, semantic layer, orchestration service, or BI platform can support dashboards that become a source of truth, but none removes the need to decide grain, ownership, timing, and recovery. Prefer interfaces that preserve lineage from a summary to its inputs, role-based access that matches the work, and observable status for freshness and controls. The Google Cloud data analytics architecture guidance provides a useful architecture perspective on separating ingestion, processing, storage, and consumption concerns. The same principle applies across platforms: a clean boundary makes changes easier to test and failures easier to explain. For further implementation context, see a related planning guide, a related planning guide, metric layer implementation checklist, data lineage architecture guide.
Change management is part of dependable dashboards that become a source of truth, not a cleanup task for a later phase. Keep a compact change record whenever a source field, business rule, threshold, model, or access decision changes. It should say what changed, why it changed, who approved it, which readers or historical periods may be affected, and how the team checked the result. Use a staged release for material changes: compare old and proposed calculations on representative records, obtain the domain owner’s interpretation, and communicate the effective date before the next decision cycle. When a historical value is intentionally restated, preserve both the reason and the scope so readers do not mistake a definition change for operational movement. This practice is especially valuable when new teams inherit the service, because it turns inherited assumptions into inspectable evidence. It also gives business and delivery owners a shared way to decide whether a change needs a simple note, a controlled rollout, or a temporary hold.
Frequently asked questions about dashboards that become a source of truth
How many measures should the first release include? Include only the measures needed for the stated decision and its investigation path. A smaller set with definitions, freshness, and accountable owners is more useful than a broad catalog of unexplained values. Add a measure after a real reader can name the decision it changes, the source that supports it, and the person who will maintain its meaning. In dashboards that become a source of truth, that restraint keeps the first release tied to a decision rather than a catalog.
What should happen when data quality is uncertain? Do not make readers infer the situation. Show affected scope and freshness, then follow the agreed response: qualify a low-risk result, hold a material result, or route an exception to the named resolver. The key is consistency. A visible exception with a known owner protects trust better than a clean-looking result whose limitations are discovered later. For dashboards that become a source of truth, that visible response protects readers from acting on an uncertain result.
Key takeaways for dashboards that become a source of truth
- Anchor dashboards that become a source of truth to one recurring decision and a defined time horizon.
- Make grain, ownership, source authority, freshness, and limitations visible to readers.
- Attach every material quality condition to an agreed response and resolver.
- Release in the real work setting, then improve definitions from questions and incidents.
Conclusion: make dashboards that become a source of truth useful under scrutiny
Dashboards That Become A Source Of Truth earns trust when it helps people act without asking them to take the logic on faith. Begin with the decision, document the evidence and its limits, make exceptions operational, and keep the result reviewable as source systems and business rules change. That discipline turns a one-time dashboard, model, or scheduled job into a service that can support real work.