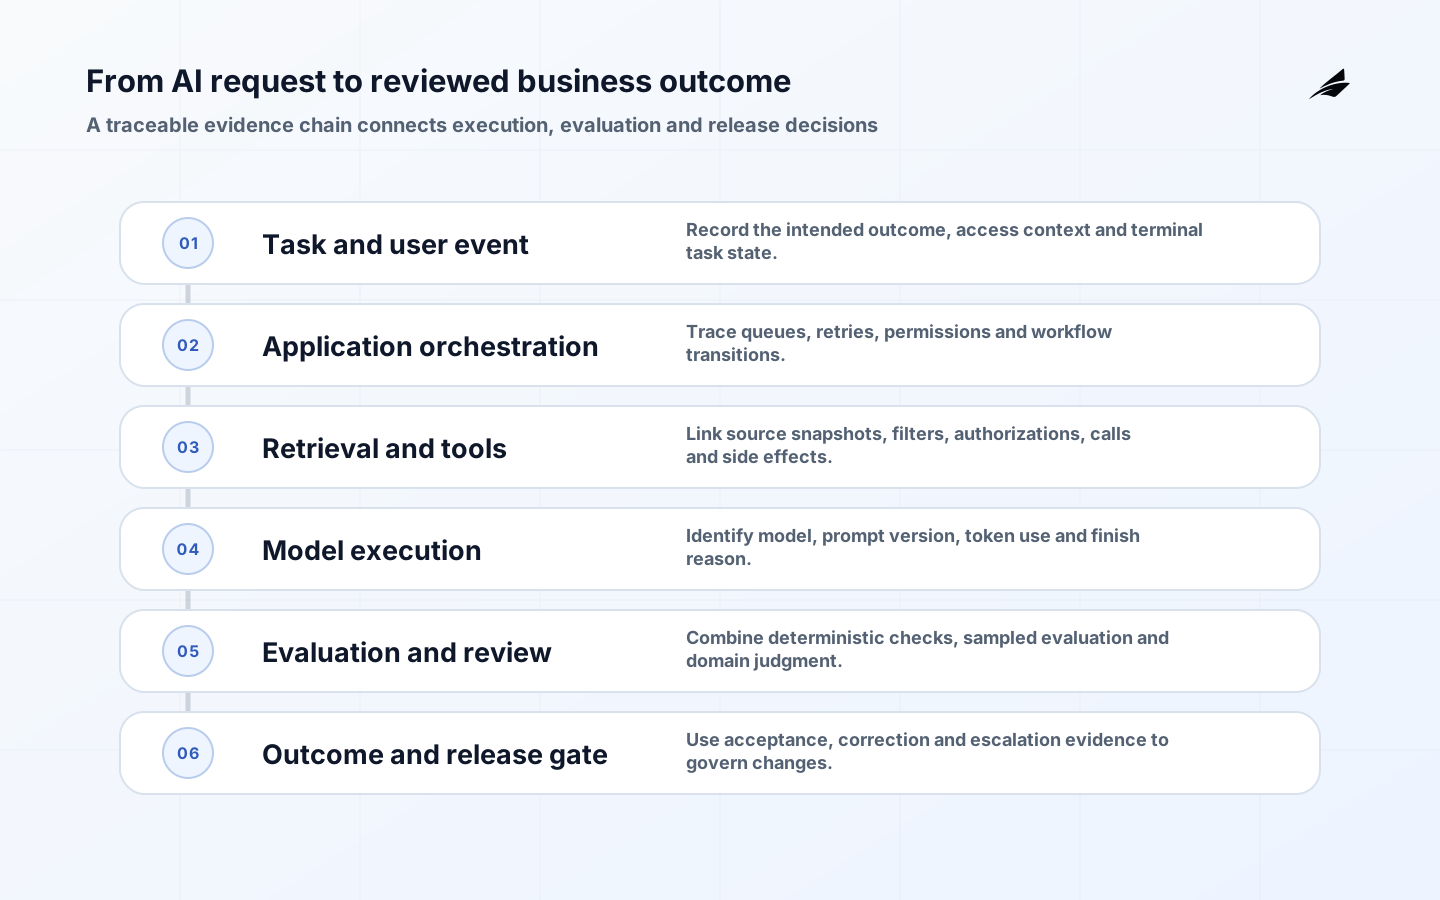
An internal AI tool can return an HTTP 200 response and still fail the business. It may cite an obsolete policy, choose the wrong tool, omit a required approval, expose another team's data or spend more than the task is worth. Model observability is the operating discipline that makes those failures visible. It combines conventional service telemetry with AI-specific traces, evaluations, user feedback, data-quality checks and an accountable review process.
Model observability begins with practical questions: what to log after an AI pilot, which metrics prove quality, and how to debug a bad answer without retaining every prompt forever. The answer is not a single dashboard. It is a linked evidence model that can reconstruct a request, assess its outcome and show which version of the model, prompt, retrieval index, policy and tool produced it.
Start with the task outcome, not the model
Define one unit of work before selecting metrics. For an HR policy assistant, that unit may be a question resolved with an approved citation. For a finance agent, it may be an exception classified and routed to the correct reviewer. Give the unit a terminal state such as accepted, corrected, escalated, abandoned or failed. This creates a denominator for quality and cost calculations; raw request volume does not.
- State the user, decision and consequence for each supported use case.
- Define what success and safe refusal look like in observable terms.
- Name a business owner for output quality and an engineering owner for service reliability.
- Record unsupported uses so monitoring does not silently normalize scope expansion.
- Choose a review cadence and the conditions that can pause or roll back the workflow.
Observe five layers of the AI workflow
A useful observability model spans the entire application. Infrastructure telemetry explains capacity and network failures. Application telemetry shows queues, retries and permissions. AI traces expose model, retrieval and tool steps. Evaluation records judge output quality. Business events show whether users accepted the result and completed the task. Google Cloud's architecture guidance similarly treats generative-AI observability as an end-to-end concern across infrastructure, application, data and model behavior.
| Layer | Signals to retain | Question it answers | Typical alert |
|---|---|---|---|
| Infrastructure | Latency, traffic, errors, saturation, provider availability | Can the service respond reliably? | Error budget burn or queue age |
| Application | Workflow state, retries, permission denials, dependency versions | Where did execution stop or repeat? | Repeated action or failed integration |
| AI execution | Model and prompt version, retrieval IDs, tool calls, token counts, finish reason | Which component shaped the output? | Unexpected tool or token spike |
| Evaluation | Groundedness, correctness, relevance, policy compliance, evaluator version | Was the result suitable for this task? | Quality falls below a calibrated control limit |
| Business outcome | Acceptance, correction, escalation, completion time, resolved-task cost | Did the tool improve the work? | Corrections or bypasses rise |
Design a trace that can reproduce a decision
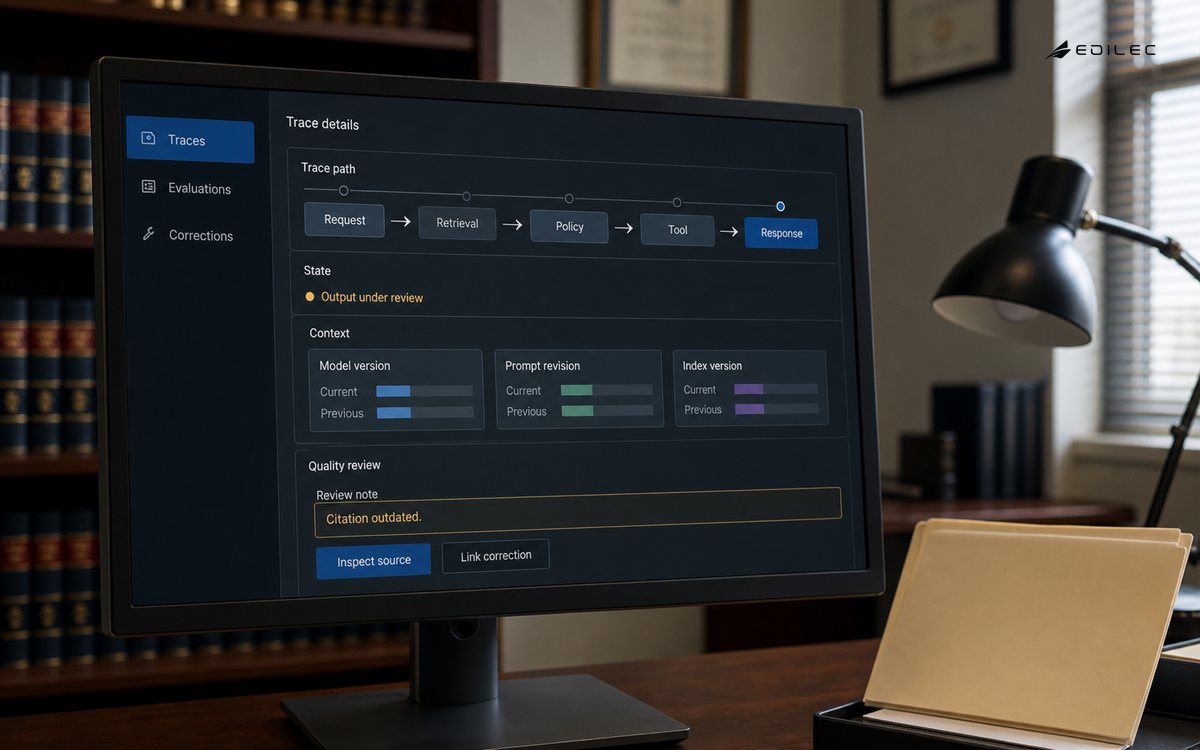
Use one trace identifier from the user action through orchestration, retrieval, generation, tool execution and final review. Create spans around meaningful operations rather than every local function. The current OpenTelemetry generative-AI registry includes concepts for provider, request and response model, operation, prompt name, data-source ID, retrieved documents, tool calls, token usage and evaluation scores. The conventions are evolving, so pin the convention version and isolate mappings in the instrumentation layer.
A trace should identify configuration without turning the log store into a copy of the conversation. Store stable IDs and hashes for prompt templates, policy bundles and retrieval snapshots. Retain the minimum content needed for sampled debugging, with role-based access and explicit retention. OpenTelemetry warns that input and output messages are likely to contain sensitive information; OWASP likewise identifies personal, financial, legal and confidential business data as disclosure risks.
| Field group | Recommended representation | Avoid |
|---|---|---|
| Identity | Trace ID, tenant ID, pseudonymous user or role ID | Names, email addresses and free-text identity in metric labels |
| Configuration | Model ID, prompt version, workflow version, feature flags | Unversioned 'current' values |
| Retrieval | Index version, source document IDs, scores, filters, freshness timestamp | Entire confidential documents in span attributes |
| Tools | Tool name, permission outcome, idempotency key, duration, result status | Secrets, full payloads or credentials |
| Outcome | Finish reason, evaluation labels, review action, final task state | A single opaque success boolean |
Separate online signals from quality evaluation
Online metrics should be cheap and fast: latency, errors, tool failures, token use, refusal rate, citation presence and user actions. Deeper evaluation can run asynchronously on a risk-weighted sample. Build a labeled set from real, permission-cleared tasks and include ordinary cases, high-impact cases, known failures and adversarial inputs. Compare production performance with the pre-release baseline, as the NIST AI RMF Playbook recommends, and document material differences.
Use deterministic checks where possible: schema validity, required citation, approved source, correct tool permission and arithmetic reconciliation. Use human domain reviewers for correctness that depends on policy or judgment. Model-based graders can increase coverage, but they are another measured component: version the grader, define its rubric, test agreement against expert labels and never present its score as ground truth.
- Evaluate the whole task as well as retrieval, generation and tool substeps.
- Report results by use case, risk tier, language, source and workflow version; an overall average can hide a failing segment.
- Track false acceptance and false escalation separately when automation gates consequential actions.
- Preserve reviewer rationales and corrected outcomes as evaluation evidence, not as automatic training data.
- Re-run the fixed evaluation suite before changing models, prompts, indexes, tools or policies.
Choose metrics for RAG and agents
For RAG, monitor source ingestion success, document freshness, index lag, filter application, retrieval relevance and whether claims are grounded in the returned context. An answer-quality drop may originate in a stale policy, malformed chunk, access filter or generator. For agents, observe tool selection, authorization decisions, argument validation, repeated calls, side-effect confirmation and the final business state. A syntactically valid tool call is not a successful task.
| Metric | Definition | Interpretation |
|---|---|---|
| Accepted outcome rate | Accepted terminal outcomes divided by reviewed eligible tasks | Primary usefulness signal; pair with risk and use-case slices |
| Correction rate | Reviewed outputs requiring a material edit | Rising values can indicate drift, stale data or a release regression |
| Grounded claim rate | Evaluated factual claims supported by retrieved approved sources | Diagnose jointly with retrieval relevance and citation accuracy |
| Tool success rate | Authorized tool calls reaching the intended verified state | Exclude blocked calls from provider-error calculations |
| Cost per resolved task | Model, retrieval and tool variable cost divided by resolved tasks | More useful than cost per request when workflows retry or escalate |
Example: diagnose a policy assistant regression
Suppose employees report that a leave-policy assistant has become less useful. Service latency and error rate are unchanged, but accepted outcome rate has fallen and correction rate is concentrated in one region. Traces show the same model and prompt versions; retrieval spans show that the regional policy index has not completed ingestion since a connector credential rotated. The team restores ingestion, reindexes the missing documents, runs the regional evaluation slice and only then closes the incident.
This diagnosis is possible because business outcome, configuration lineage and retrieval freshness share a traceable identity. Without those links, the team might tune a prompt or replace a model, adding change without addressing the failed data pipeline. For adjacent architecture patterns, Edilec's RAG guide explains the source and retrieval layer, while AI agents in business workflows covers tools and approvals.
Protect telemetry as production data
Logs are a new data store with their own threat model. Classify fields before collection; redact or tokenize sensitive values at the instrumentation boundary; keep prompts and retrieved content opt-in; encrypt storage and transport; separate tenant access; audit queries and exports; and apply deletion schedules. Do not put secrets in prompts, tool definitions or traces. Security tests should attempt cross-tenant retrieval, prompt injection, unauthorized tool use and leakage through error messages.
Roll out observability in six steps
- Map one production workflow, its terminal states, owners, risks and current baseline.
- Instrument a trace across orchestration, retrieval, model calls and tools using stable version identifiers.
- Add privacy filters, access controls, sampling rules and retention before recording content.
- Build a reviewed evaluation set from real cases and define release gates for material risks.
- Create dashboards for service health, quality, business outcomes and resolved-task cost; route each alert to an owner.
- Pilot with a bounded group, review traces and corrections weekly, then widen traffic only when rollback and incident routines work.
Start small enough that humans can inspect the evidence. During the pilot, compare automated metrics with reviewer judgment, measure telemetry overhead and test whether an operator can reproduce a failure from the trace. Add sampling before volume makes full-content retention expensive. A mature program keeps full metadata for an appropriate period, samples content according to risk and retains evaluation evidence long enough to compare releases.
Key takeaways
- Observe task outcomes, not only model calls.
- Link traces, configuration versions, evaluations and human decisions with stable identifiers.
- Use deterministic checks first and calibrated human or model-based evaluation where judgment is required.
- Treat prompts, responses and retrieved content as sensitive opt-in telemetry.
- Alert on actionable deviations from a baseline, with a named owner and rollback path.
Frequently asked questions
What is the difference between AI monitoring and AI observability? Monitoring watches predefined signals and thresholds. Observability preserves enough linked context to investigate failures that were not predicted in advance. Production teams need both: monitoring for timely action and traces, versions and evidence for diagnosis.
Should every prompt and response be logged? No. Full content can create privacy, confidentiality, security, retention and cost exposure. Default to metadata and version IDs, then use redacted, access-controlled sampling when content is necessary for evaluation or incident analysis.
Which metric matters most? Use a task-level outcome tied to the workflow, such as accepted resolved cases, alongside risk measures. No universal quality metric substitutes for a clear definition of a successful and safe task.
How often should production outputs be evaluated? Continuously sample online signals, run deeper evaluations on a risk-based schedule, and run the fixed release suite whenever the model, prompt, retrieval source, index, tool or policy changes. Increase sampling after incidents and major shifts in input mix.
Conclusion
Model observability becomes useful when it shortens the distance between a bad outcome and a responsible correction. Build the evidence chain around real work: task state, configuration lineage, retrieved sources, tool effects, evaluation and human review. That foundation lets an internal AI tool improve without becoming opaque. Teams designing the wider operating platform can connect this work to Edilec's AI automation services and zero-trust guide for workflow and access-control planning.