Observability architecture for small teams should reduce the time from a user-visible problem to a confident action without creating an expensive telemetry project. Logs, metrics and traces are inputs, not the outcome. Start with the few journeys the business depends on, define what correct service looks like and collect enough correlated evidence to detect failure, bound its impact and test a hypothesis. The architecture should remain understandable to the people who operate it.
This guide assumes a team running a web service, API, worker or scheduled pipeline with limited platform capacity. It pairs naturally with the incident response plan and backup and restore testing guide. Tool selection comes after signal design. A modest system with disciplined context and alert ownership is more useful than several disconnected observability products.
Begin with user journeys and operating questions
Choose three to five critical journeys, such as sign in, submit order, generate report, process payment or complete a scheduled import. For each, identify success, correctness, acceptable latency, volume, dependencies and business owner. Include asynchronous completion: an API returning 202 Accepted is not success if the queued job never finishes. Create a stable journey or operation name used in metrics, traces, logs and runbooks.
Write the questions operators must answer: Are users failing now? Which journey, tenant tier or region is affected? Did the condition begin after a release? Is the dependency slow, saturated or returning errors? Can we mitigate by rollback, traffic shift or feature control? Instrumentation that does not support a current question belongs behind higher-value signals. Revisit the list after incidents because real failures reveal missing context.
| System shape | First signals | Useful diagnostic context |
|---|---|---|
| Request-response service | Rate, errors, latency and saturation | Route template, status class, release and dependency |
| Queue or stream | Arrival rate, completion rate, age and dead letters | Job type, attempt, producer and consumer version |
| Scheduled job | Last success, duration and records processed | Run identifier, stage and failure class |
| Data pipeline | Freshness, completeness and rejected records | Dataset, partition, source and transformation version |
| External integration | Success ratio, latency and retry backlog | Provider operation and bounded error category |
Give metrics, traces and logs distinct jobs
OpenTelemetry defines supported signals including traces, metrics and logs. Use metrics for aggregate health and alert conditions, traces for the path and timing of representative operations, and structured logs for discrete events requiring detail. Avoid making logs the only health measure: searching arbitrary text is brittle and expensive. Avoid tracing every request indefinitely when sampling can retain errors and representative traffic. Each signal should have a retention and cost purpose.
Standardize service name, environment, version, operation name and bounded error class. Propagate trace context across HTTP, messaging and worker boundaries. OpenTelemetry's context propagation guidance explains how trace and span identifiers can correlate logs with traces across services. Do not propagate secrets or unrestricted customer identifiers as baggage. Use a safe internal request or workflow identifier when support needs end-to-end lookup.
Build a simple, failure-aware collection path
A practical architecture has application and infrastructure instrumentation, a local or shared collector, durable enough backends for metrics and logs, trace storage, dashboards and alert routing. The collector can enrich resource metadata, batch, sample and export without embedding every vendor endpoint in applications. Keep the path observable: track dropped spans, failed exports, queue pressure and ingestion latency. If telemetry fails, production traffic should normally continue, but the loss must become visible.
Control cardinality at design time. User IDs, raw URLs, request IDs and unbounded error text can create a new time series for every event. Prometheus's instrumentation guidance advises care with labels and suggests starting with none when uncertain. Put high-cardinality detail in traces or logs, while metrics use route templates, status classes and bounded dimensions. Estimate ingest and retention cost before enabling a new attribute fleet-wide.
| Telemetry layer | Minimum control | Failure to test |
|---|---|---|
| Instrumentation | Stable names, units and bounded attributes | New route or error creates cardinality growth |
| Propagation | Trace context across every async boundary | Queue consumer loses the parent workflow |
| Collector | Batch limits, retry bounds and self-metrics | Backend outage fills local memory or disk |
| Storage | Retention by signal and access control | Sensitive data appears in searchable fields |
| Alerting | Owner, severity, runbook and deduplication | One incident generates many unactionable pages |
Turn user expectations into service indicators
Define a service level indicator from events that represent the user experience, such as the proportion of eligible report requests completing correctly within a threshold. Specify numerator, denominator, exclusions and measurement point. A server uptime metric can look healthy while a dependent workflow fails. Start with one availability or correctness indicator and one latency indicator for each critical journey; add complexity only when it changes a decision.
Google's Monitoring Distributed Systems describes latency, traffic, errors and saturation as four golden signals and emphasizes low-noise alerting. Use them as a prompt, not a mandatory dashboard template. A queue needs age and throughput; a batch job needs last successful completion. Connect service objectives to release and incident decisions, and document the consequences of consuming the error budget too quickly.
Page only for conditions that require timely action
Every page needs a symptom, urgency, owner, first checks and safe mitigations. Prefer an alert on sustained user-impacting error ratio over individual exceptions. Route capacity trends, dependency warnings and nonurgent failures to review queues. Group related alerts and inhibit secondary symptoms when a clear primary condition exists. Review every page afterward: if no action was possible or necessary, change the condition or destination.
Keep the alert path simpler and more reliable than the service it watches. Google SRE's practical alerting chapter argues for monitoring as a basis for rational decisions and simple alert computations. Test notification routing, escalation and access during a game day. A runbook should link directly to the relevant dashboard and queries, state common false positives and name rollback or traffic controls.
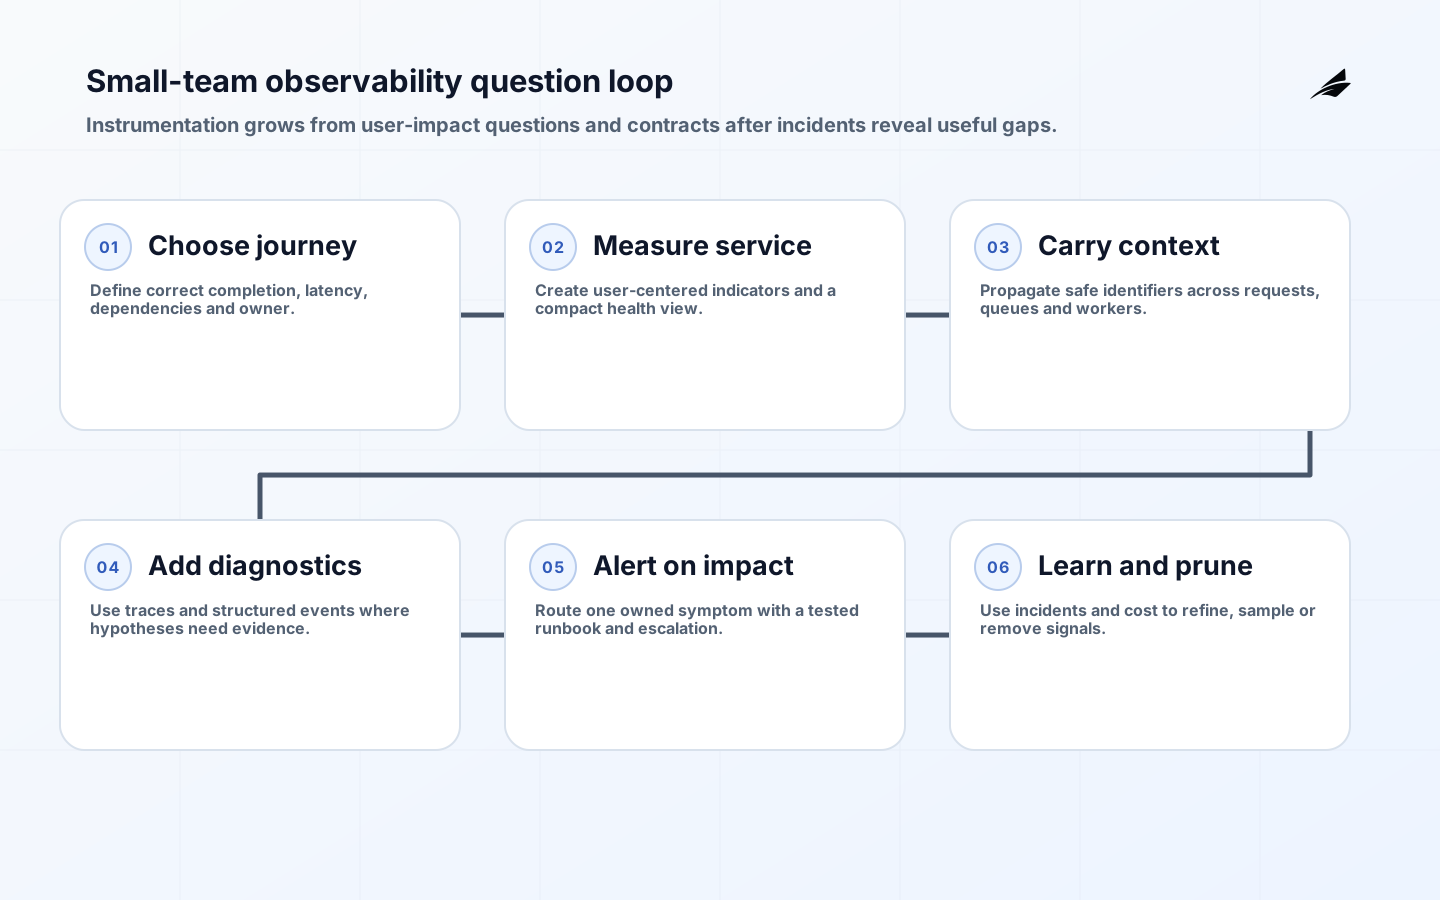
Implement observability through a six-step loop
- Select a critical journey and define correct completion from the user's perspective.
- Create service indicators and a small health dashboard with release markers.
- Propagate context and add structured events at major state transitions.
- Add traces and dependency metrics for the most costly diagnostic gaps.
- Create one actionable alert with an owner, runbook and tested route.
- Use incidents and cost reports to refine, sample or remove telemetry.

Govern telemetry cost and sensitive data
Set budgets by signal, service and environment. Use shorter retention for verbose development logs, tail or probability sampling for traces and recording rules for repeated metric queries. Keep enough evidence for incident and security needs, but do not retain every debug event by default. Track bytes ingested, active time series, trace sampling and expensive queries. Make a team owner approve high-cardinality dimensions or retention increases.
Classify telemetry as data. Redact secrets, tokens, request bodies and unnecessary personal fields before export. Restrict production query access, audit sensitive searches and define deletion or retention obligations. Use synthetic tests to verify redaction and context propagation. The platform engineering paved-road guide shows how a small team can package these defaults so each service does not solve them independently.
Validate the architecture with a short observability game day. Introduce a known dependency slowdown, a failed queue consumer and a telemetry-backend interruption. Ask an engineer who did not build the dashboard to identify user impact, affected scope, likely cause and safe mitigation. Record missing context, misleading panels, query time and alert noise. Then repair instrumentation and runbooks before adding new signals. Repeat after major topology changes. This exercise tests whether the system supports reasoning under pressure, which is a stronger acceptance criterion than confirming that agents and collectors are merely sending data.
Keep a lightweight telemetry catalog with each critical signal's meaning, unit, owner, source, retention and dashboards or alerts that depend on it. Deprecate names through a measured overlap rather than silently changing semantics. Review the catalog when services split or queues are renamed. Stable signal contracts keep long-term trends comparable and prevent a cleanup from disabling an alert or service objective without notice.
Key takeaways
- Start with critical user journeys and the questions operators must answer.
- Use metrics for aggregate health, traces for paths and logs for detailed events.
- Propagate safe context while keeping metric attributes bounded.
- Alert on actionable user symptoms and test the complete response path.
- Continuously manage telemetry cost, retention, access and sensitive data.
Frequently asked questions
Does a small team need separate tools for every signal?
No. An integrated managed platform may reduce operating burden, while open components can improve portability and control. Choose from query needs, retention, security, cost and team skill. Preserve open instrumentation and export paths where practical so the application is not coupled to a proprietary agent.
Should all application logs be retained?
No. Retain events required for operations, audit and security according to defined periods. Sample or drop repetitive diagnostics, lower verbosity after stabilization and avoid sensitive payloads. Metrics should reveal frequency; traces and selected logs should explain representative failures.
When should distributed tracing be added?
Add it when a critical operation crosses services, queues or third parties and aggregate metrics cannot identify where time or failure occurs. Begin with context propagation and automatic instrumentation, then add business spans around meaningful transitions. Sample intentionally and verify that asynchronous parents remain connected.
Conclusion
A small team needs observability that is coherent, not maximal. Define user-centered indicators, give each signal a job, carry context across the workflow and page only when a person can improve the outcome. A simple architecture that survives backend failure and controls data cost will support better incidents, releases and capacity decisions than a large collection of unowned telemetry.