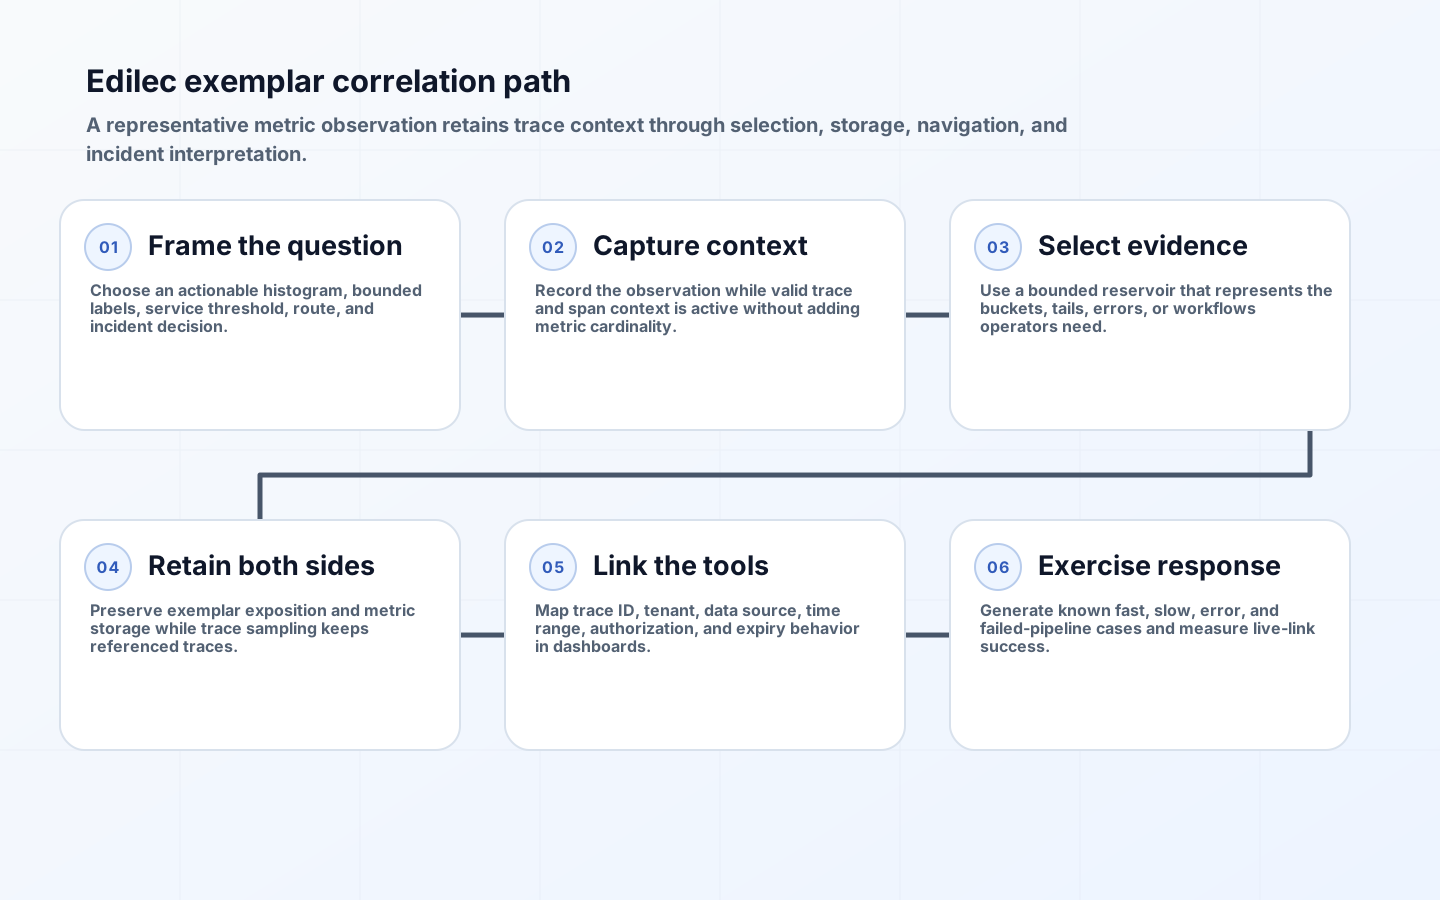
Prometheus exemplars attach a representative observation, commonly including a trace identifier, to an otherwise aggregated metric sample. They let an operator move from “latency is bad in this bucket and time window” to a concrete request trace without guessing labels or searching timestamps manually. The feature is most valuable when the metric, exemplar, stored trace, and dashboard all describe the same operation. Merely emitting a trace ID does not create that chain.
The Prometheus exemplar concept treats an exemplar as a reference to data outside the metric set. It is not a complete trace and does not make every request individually addressable. A reservoir chooses a bounded number of observations, storage retains those references, and the trace backend must retain the referenced trace. Design the path around an incident question and test every handoff.
Define the metric-to-trace incident question
Start with one histogram that already drives action, such as server request duration for a checkout endpoint. State the question: when the slow tail rises, an on-call engineer needs a trace from the affected service, route, status class, and interval. Confirm the histogram labels narrow the population without unbounded dimensions. Exemplars add high-cardinality trace context to selected observations; they are not permission to put trace IDs into normal Prometheus labels.
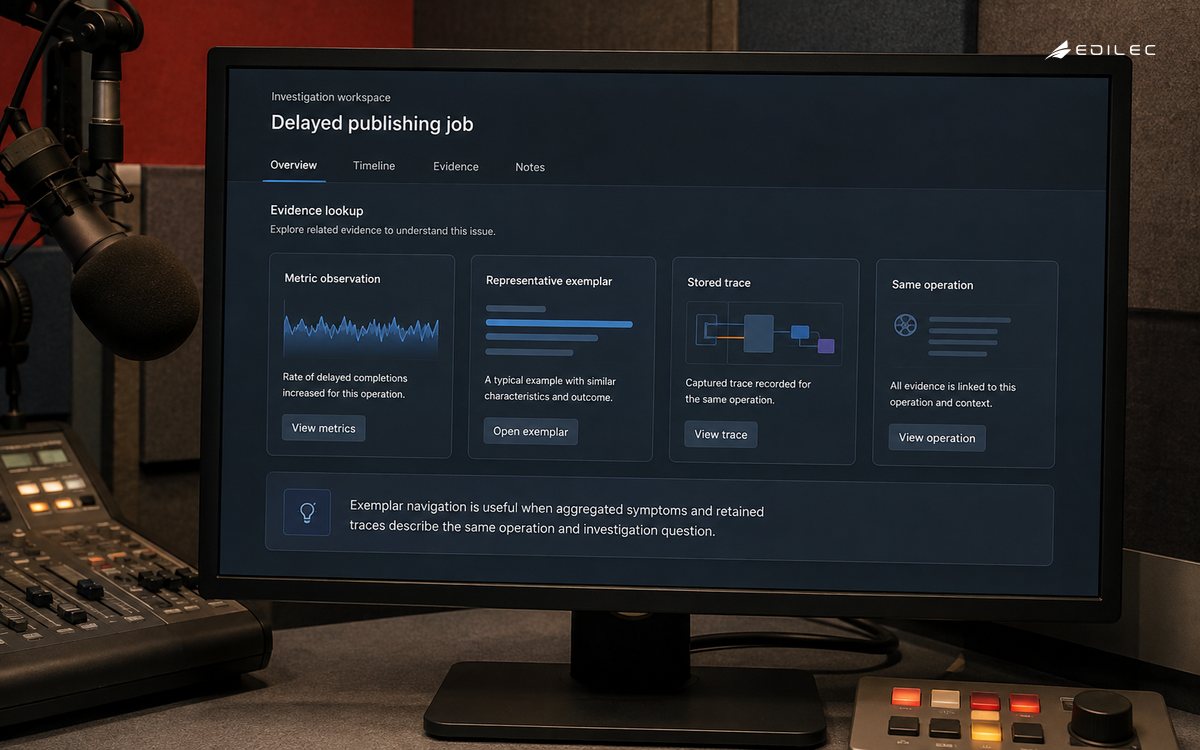
Choose bucket boundaries from service objectives and observed distributions. A trace linked from a broad +Inf bucket may be technically valid yet operationally random. Boundaries around the alert threshold make exemplars more representative of the symptom. The Prometheus histogram practices explain aggregation tradeoffs: classic histograms aggregate across instances when buckets are consistent, while client-side summary quantiles do not provide the same aggregation behavior. Exemplar navigation should reinforce, not compensate for, a poorly designed metric.
| Link | Required fact | Failure symptom | Verification |
|---|---|---|---|
| request to metric | observation records active trace context | metric rises but no exemplar appears | instrumented request fixture |
| metric to storage | exposition and ingestion preserve exemplar | scrape has a link but query does not | scrape and API comparison |
| exemplar to trace | trace ID format and tenant match | dashboard opens no trace | direct backend lookup |
| trace sampling | referenced trace is retained | intermittent dead links | paired sampling test |
| dashboard navigation | time, data source and URL mapping are correct | wrong tenant or time range | on-call click-through exercise |
Instrument trace context at metric observation
Record the latency observation while the request’s span context is current and valid. OpenTelemetry SDKs can associate exemplars with measurements under an exemplar reservoir and filter model. Verify support in the exact language SDK and exporter versions. Wrapper metrics, asynchronous callbacks, thread hops, and queue consumers can lose context; tests must exercise those paths instead of assuming automatic instrumentation covers them.
Keep exemplar labels minimal. A trace ID and, where the ecosystem uses it, span ID are usually enough. Identity, route, method, and status should already come from bounded metric labels and trace attributes. Do not copy customer identifiers or request payloads into the exemplar. The OpenMetrics 1.0 specification bounds exemplar label-set size and defines placement and value rules. Even where a newer format allows more, small references are safer and easier to interoperate.
Align the exemplar reservoir with trace sampling
An exemplar reservoir decides which measurements survive for a collection interval. A uniform choice may represent normal traffic well but miss the tail that matters. A bucket-oriented histogram reservoir can retain observations across the distribution. The correct policy depends on the question: rare errors, long latency, and high-value workflows may need targeted representation. Measure exemplar coverage by relevant bucket and route, not simply total exemplars per minute.
Trace sampling is a separate decision. If the metric SDK records an exemplar for a trace later dropped by tail sampling, the link is dead. Prefer a policy that records exemplars from sampled trace contexts or ensures the trace pipeline retains referenced high-value cases. When head and tail sampling coexist, run a known test corpus and calculate live-link success. A low trace sampling rate can still support useful exemplars if selection is coordinated; an uncoordinated high rate can still produce confusing gaps.
| Choice | Benefit | Tradeoff | Good fit |
|---|---|---|---|
| Uniform exemplar selection | simple representative sampling | rare tails may be absent | broad traffic inspection |
| Histogram-bucket reservoir | coverage across latency distribution | more policy and storage complexity | tail-latency investigation |
| Sampled-context filter | fewer dead trace links | unsampled events cannot become exemplars | head-sampled tracing |
| Tail-aware retention | keeps errors and slow traces | requires coordinated gateway state | central trace pipelines |
| Always-on trace retention | high link success | potentially high storage and privacy cost | small bounded workloads |
Configure storage and dashboard navigation
Verify that the exposition format, scraper, remote-write path, long-term metric store, query API, and visualization layer support exemplars in the deployed versions. Feature labels and flags can change over time, so test behavior rather than copying an old command line. Query a short controlled range and inspect the returned exemplar timestamp, value, and labels. Confirm retention: a metric may remain for months while traces expire in days, making older links predictably unavailable.
Configure the dashboard to map the exemplar’s trace ID to the correct trace data source and tenant. Carry the relevant time range with enough margin for clock skew and long traces. Enforce the same authorization as direct trace search; a dashboard link must not bypass tenant or sensitive-data controls. Provide a graceful message when a trace has expired. On-call staff should be able to click a point, see the trace, identify the span corresponding to the metric operation, and return to the original graph.
Validate the debugging workflow under failure
Generate controlled fast, slow, error, and canceled requests with known trace IDs. Confirm histogram increments, bucket placement, exemplar presence, scrape preservation, storage query, backend lookup, and dashboard navigation. Then inject collector delay, trace-backend rejection, metric remote-write retry, and clock skew. Monitor missing-context rate, exemplar ingestion errors, live-link percentage, traces found by status class, and time from alert to a useful span.
Teach operators what an exemplar proves. It is one observation from an aggregate population, not necessarily the worst request or root cause. Compare it with neighboring exemplars and the overall distribution. If the trace shows downstream delay, validate that dependency metrics agree. If selection repeatedly returns routine traffic, revise buckets or reservoir policy. Keep ordinary label-based trace search as fallback so correlation remains possible when the optimized path fails.
Plan for multi-instance and multi-region aggregation. Exemplars originate on individual processes, while the displayed histogram may sum many replicas and remote stores. Confirm that the query layer returns exemplars across the selected series and that dashboard filtering does not accidentally hide the instance containing the useful observation. Preserve the metric labels needed to establish population, but avoid making operators choose a pod before they know which request was slow. In federated or long-term storage, verify exemplar forwarding separately from sample forwarding because support and retention can differ.
Operate correlation with explicit service objectives. Track the percentage of alerted histogram windows containing at least one relevant exemplar, the percentage of exemplar links that resolve to an authorized retained trace, and median operator time from graph to a useful causal span. Segment failures into no active context, reservoir selection, exposition loss, storage loss, trace sampling, expiry, tenant mapping, and dashboard configuration. This turns “exemplars sometimes do not work” into repairable components and prevents teams from increasing trace retention blindly when the fault is actually in metric ingestion.
Control rollout metric by metric. Begin with one service and dashboard, document expected extra storage and trace retention, and observe operator use through at least one representative load or incident exercise. Expand only after the team can explain exemplar selection and dead-link behavior. Remove abandoned mappings and stale data-source links as backends change. A small number of dependable correlations creates more incident value than enabling exemplars broadly while leaving dashboards, tenants, and retention unowned.
Key takeaways
- Begin with an actionable histogram and a specific incident question.
- Attach trace context at observation time without adding high-cardinality metric labels.
- Coordinate exemplar reservoir selection with trace sampling and retention.
- Test every hop from SDK and exposition through metric storage, dashboard, tenant, and trace backend.
- Treat an exemplar as representative evidence, not proof that the linked trace caused the aggregate symptom.
Frequently asked questions
Does an exemplar identify every request in a bucket?
No. It is a bounded representative observation selected by a reservoir. The histogram still describes the aggregate population.
Why does an exemplar link to a missing trace?
Common causes are independent sampling, shorter trace retention, tenant mismatch, malformed ID mapping, exporter loss, or a trace backend that has not finished ingesting the trace.
Are exemplars only for histograms?
The data model can support other metric points, but histograms are a natural operational fit because they connect a distribution bucket and value to a representative event. Verify support across the exact toolchain.
Conclusion
Exemplars shorten investigation when correlation is engineered as a complete path. Start with a meaningful distribution, preserve current trace context, align bounded selection with trace retention, and prove the dashboard click under realistic failures. Then a bad metric becomes a useful doorway into request-level evidence rather than another fragile hyperlink.