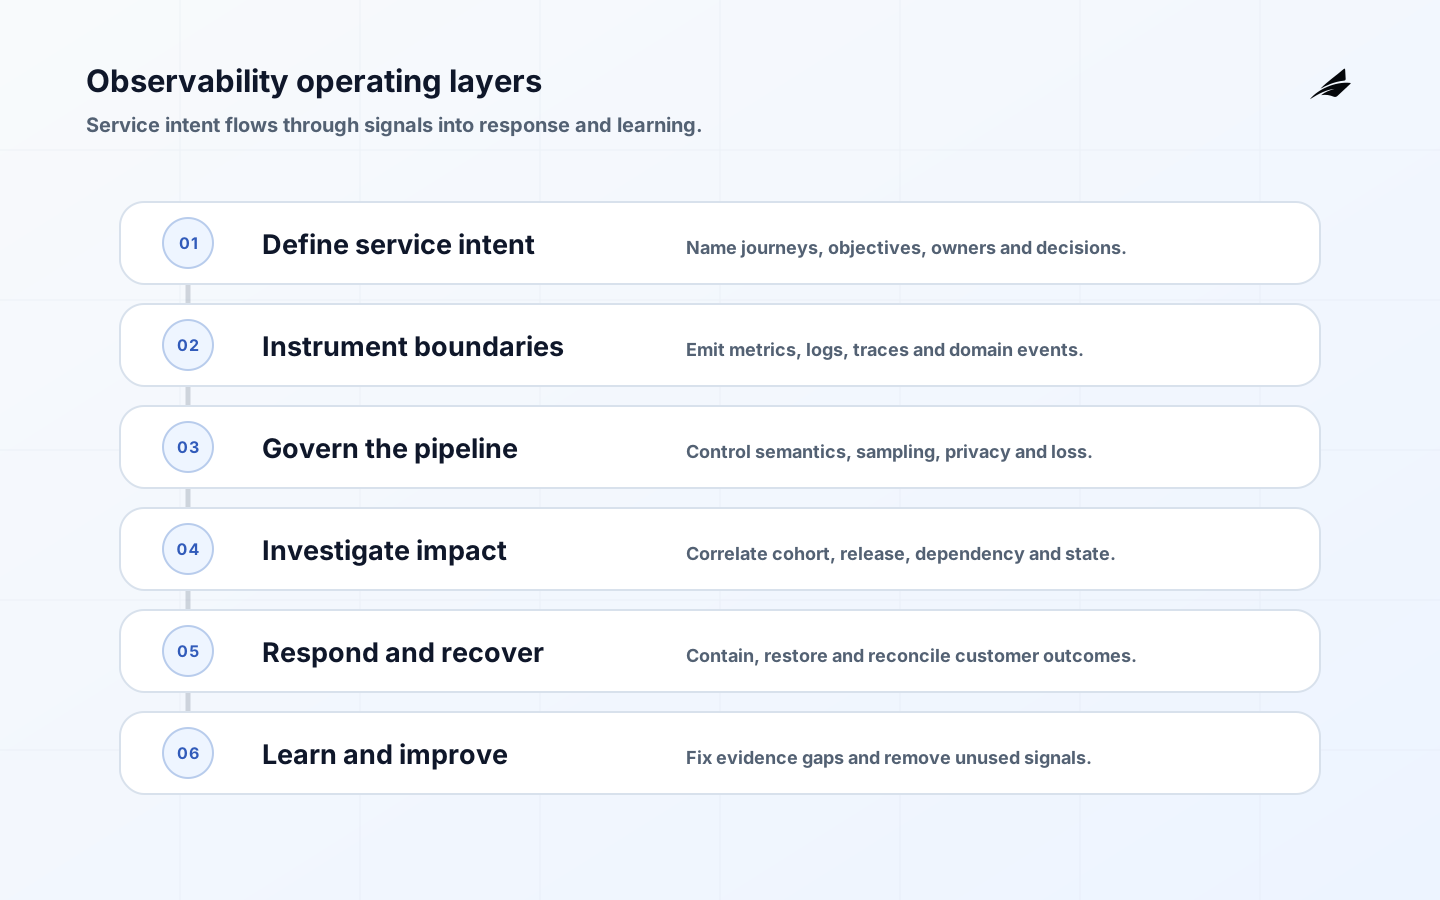
Observability for cloud and DevOps is the capability to understand service behavior well enough to make a production decision. Telemetry is its raw material, not the outcome. Teams need to detect customer-impacting conditions, determine which release or dependency is involved, contain harm, verify recovery and learn where the system lacks evidence. Collecting every event rarely achieves that goal; it can create cost, noise and sensitive-data risk while leaving the decisive user journey unexplained.
Start with one service promise and the questions an on-call responder must answer. Edilec's observability engineering guide covers program design, the distributed tracing guide follows transactions across boundaries, and the SLO planning guide turns user expectations into objectives. This tutorial connects those practices into an implementation path.
Define the service boundary and decisions first
Name the customer journey, service owner, dependencies, data classification, environments and critical operations. Define success at the boundary a user experiences: accepted order, completed export, fresh recommendation or delivered message. Infrastructure availability can support that outcome but cannot substitute for it. OpenTelemetry's observability primer connects observability with asking novel questions from emitted traces, metrics and logs and describes reliability from the user's perspective.
Write decision questions before instruments: Are users succeeding? Which cohort is affected? Did a release change behavior? Where is time spent? Is a dependency failing? Is data stale or incorrect? Can the service recover? For each, identify the signal, dimensions, owner and action. Include business process evidence for asynchronous and batch systems. A healthy CPU does not prove that yesterday's settlement completed, and a low HTTP error rate does not prove that returned content is correct.
| Decision question | Primary signal | Required context | Responder action |
|---|---|---|---|
| Are users succeeding? | Journey SLI | Cohort, region and operation | Assess impact and contain |
| What changed? | Deployment and configuration event | Revision and exposure | Pause or roll back |
| Where is delay? | Trace and queue age | Dependency and stage | Scale, route or degrade |
| Is data correct and fresh? | Domain quality indicator | Source and effective time | Suppress or reconcile |
| Can we recover? | Restore and synthetic result | Runbook and objective | Repair recovery capability |
Design metrics, logs and traces as complementary signals
Metrics aggregate behavior over time and support objectives, trends and alerts. Logs capture discrete events with detailed context. Traces connect units of work across services, queues and dependencies. Profiles can explain resource use within code. Choose the signal that answers the question economically. A metric may reveal elevated failures, a trace localize them to a payment adapter, and a structured event explain the safe response category. Correlation and consistent service identity let responders move between them.
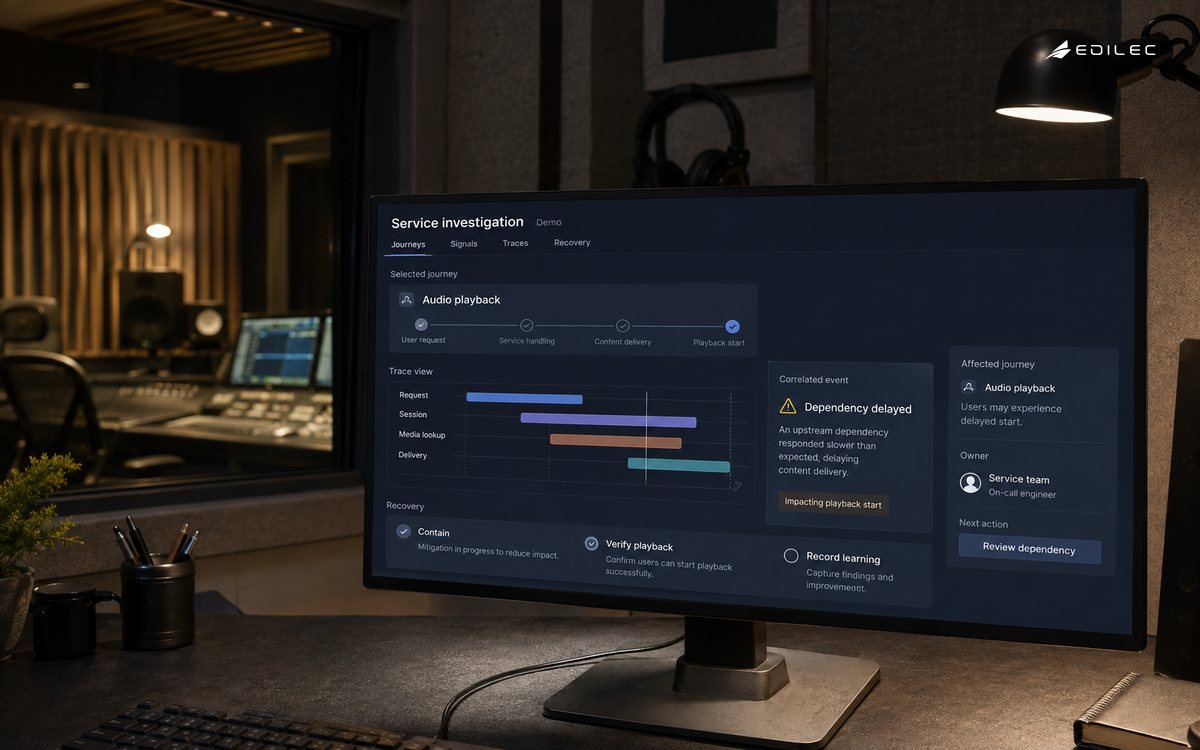
Instrument service boundaries, dependencies, queues and domain completions. Follow the Prometheus instrumentation guidance for request, error and latency signals while controlling labels. High-cardinality values such as customer, request or raw URL do not belong in metric labels. Put correlation identifiers in traces and controlled logs. Record units and histogram boundaries deliberately. Instrument failures and rejected work, not only successful requests.
Standardize service identity and semantic conventions
Define resource attributes for service, environment, version, region and owner. Use consistent operation names, status and error types across libraries and services. OpenTelemetry semantic conventions provide common names, types and meanings that improve correlation across codebases and tools. Record the convention schema version and manage changes; unstable attributes can split dashboards or silently alter queries during instrumentation upgrades.
Add domain attributes only when they support a defined use and can be governed. Prefer bounded categories over direct identifiers. Document cardinality, sensitivity, retention and query examples. Library instrumentation should provide useful baseline behavior while application code records business outcomes unavailable to a generic framework. Review instrumentation as part of API and event design. A telemetry schema is an interface consumed by alerts, dashboards, investigations and cost controls.
Build a resilient and governed telemetry pipeline
A typical pipeline includes application SDKs or agents, collectors, processing, sampling, export and one or more backends. Use collectors to enrich stable metadata, redact known sensitive fields, batch, retry and route signals. Define behavior when the backend is slow: telemetry must not exhaust application memory or block the customer path. Monitor dropped, rejected, delayed and transformed telemetry. Keep local or alternate evidence for the highest-priority recovery paths where a central platform outage would create blindness.
Sampling should preserve useful distributions and important failures. Head sampling is simple but cannot know the final outcome; tail sampling can retain errors and slow traces but adds state and delay. Document policy and effective rates so analysts do not treat a sample as a complete event count. Control access and retention by signal and field. Redact before export where possible. Test that deletion and incident holds work across telemetry copies.
| Telemetry risk | Design control | Health measure | Review trigger |
|---|---|---|---|
| Cardinality explosion | Bounded dimensions and budgets | Active series and ingest rate | New attribute or cost spike |
| Sensitive content | Minimize, redact and restrict | Policy violations and access | Schema or data-source change |
| Pipeline loss | Queue, retry and drop policy | Dropped and delayed signals | Backend or network failure |
| Sampling bias | Documented outcome-aware policy | Effective sample by cohort | Traffic-shape change |
| Vendor dependence | Portable instrumentation and export | Migration and dual-write test | Contract or architecture change |
Use SLOs and error budgets to focus attention
Select a service-level indicator that measures a user-relevant success ratio, latency distribution or freshness condition. Define eligible events, good events, window and objective. Segment journeys with different consequences instead of averaging them into a flattering number. Verify that the indicator still works during partial failure. An SLO is a decision tool for balancing reliability and change, not a promise that every request succeeds.
Use error-budget consumption to trigger action: investigate, slow risky releases, prioritize reliability or revise an invalid indicator. Keep contractual SLAs distinct from internal objectives. Google's monitoring distributed systems guidance highlights latency, traffic, errors and saturation, but also asks that monitoring remain simple and actionable. Pair technical objectives with correctness and completion where the service can return a fast wrong answer.
Alert on actionable customer symptoms
Page when prompt human action can prevent or reduce material impact. Route nonurgent work to tickets and retain diagnostic signals on dashboards. Prometheus alerting guidance recommends simple symptom-based alerts and avoiding pages where nothing can be done. Use sustained thresholds or multi-window objective burn to control noise. Include service, impact, current value, relevant change, dashboard, runbook and owner in the notification.
Test routing, deduplication, inhibition, schedules and escalation. Monitor the monitoring system with an end-to-end synthetic signal, not only component health. Review false positives, missed incidents, repeated alerts and time to useful diagnosis. Remove alerts that consistently produce no action. Capacity warnings need sufficient lead time and an owner; a page after exhaustion is an incident alert, not capacity management. Ensure the alert itself does not expose customer data.
Design dashboards and traces for investigation
Create a service overview around user outcomes, objective burn, traffic, errors, latency, saturation, dependencies, releases and telemetry health. Allow drill-down by bounded dimensions without producing a page for every component. Link a chart to representative traces and structured events. Annotate deployments and policy changes. Dashboard ownership, data source, refresh and intended decisions should be visible in metadata so responders know whether a panel is authoritative.
Trace across synchronous requests, messages and scheduled work by propagating context safely. Model queue publish, receive and processing separately so waiting time is visible. Use span links when work has many parents or batch relationships rather than forcing an inaccurate tree. The distributed tracing practical guide covers this implementation in depth. Preserve enough domain context to reconcile failed work without recording sensitive payloads.
Adopt observability one critical journey at a time
Choose a journey with known pain and an accountable team. Establish its objective, add boundary and dependency signals, instrument one end-to-end trace, create a decision-oriented dashboard and route one actionable alert. Replay a known incident or run a controlled failure. Measure whether responders detect, localize, contain and verify recovery faster. Fix identity, context and ownership gaps before standardizing the pattern across services.
Provide shared libraries, collectors, conventions and templates, but let service teams own domain outcomes. Set budgets for cardinality, volume and retention. Allocate telemetry cost by service and signal, then compare with investigative and compliance value. Remove duplicate or unused data only after testing detection and diagnosis. Review instrumentation after incidents, architecture changes and vendor migrations. Observability is maintained product infrastructure, not a one-time installation.
Run an observability readiness review
Before a critical launch, inject one representative failure and have the intended on-call team work from page to verified recovery. Record detection source, elapsed time, queries used, missing permissions, unsafe data exposure and reconciliation result. Confirm dashboard and runbook ownership, alert routing, telemetry retention and pipeline health. Turn every gap into an owned change and repeat after material architecture or support-boundary changes. This exercise tests the decision system, not merely whether a collector emits data.
Observability for cloud and DevOps FAQ
Is observability different from monitoring?
Monitoring collects and presents known conditions; observability emphasizes the ability to investigate novel behavior from system outputs. In practice they overlap. A good program supports both predictable alerts and exploratory diagnosis with shared, governed signals.
Do we need metrics, logs and traces for every service?
Use the signals needed for the service's decisions. Most online distributed services benefit from all three, but depth varies. A small batch job may need completion, duration, errors and structured run records before full tracing adds value.
Should one vendor store all telemetry?
A unified backend can simplify correlation, while legal, cost, scale or resilience needs may justify routing. Keep instrumentation portable, export controlled and service identity consistent so the organization can change storage without rewriting every application.
Key takeaways
- Begin with user outcomes and production decisions, not a telemetry shopping list.
- Design metrics, logs and traces to correlate without uncontrolled cardinality or sensitive data.
- Monitor the telemetry pipeline, sampling and semantic version as production dependencies.
- Page on actionable symptoms and test routing, investigation and recovery.
- Adopt by journey, measure decision improvement and remove signals with no use.
Conclusion: make production behavior explainable
Observability for cloud and DevOps is successful when a responder can connect customer impact to a change or dependency, act safely and prove recovery. Define the service promise, instrument complementary signals, govern their pipeline, alert with restraint and practice investigation. The result is not merely more data; it is a production system that yields useful evidence when the team faces a question it did not predict.