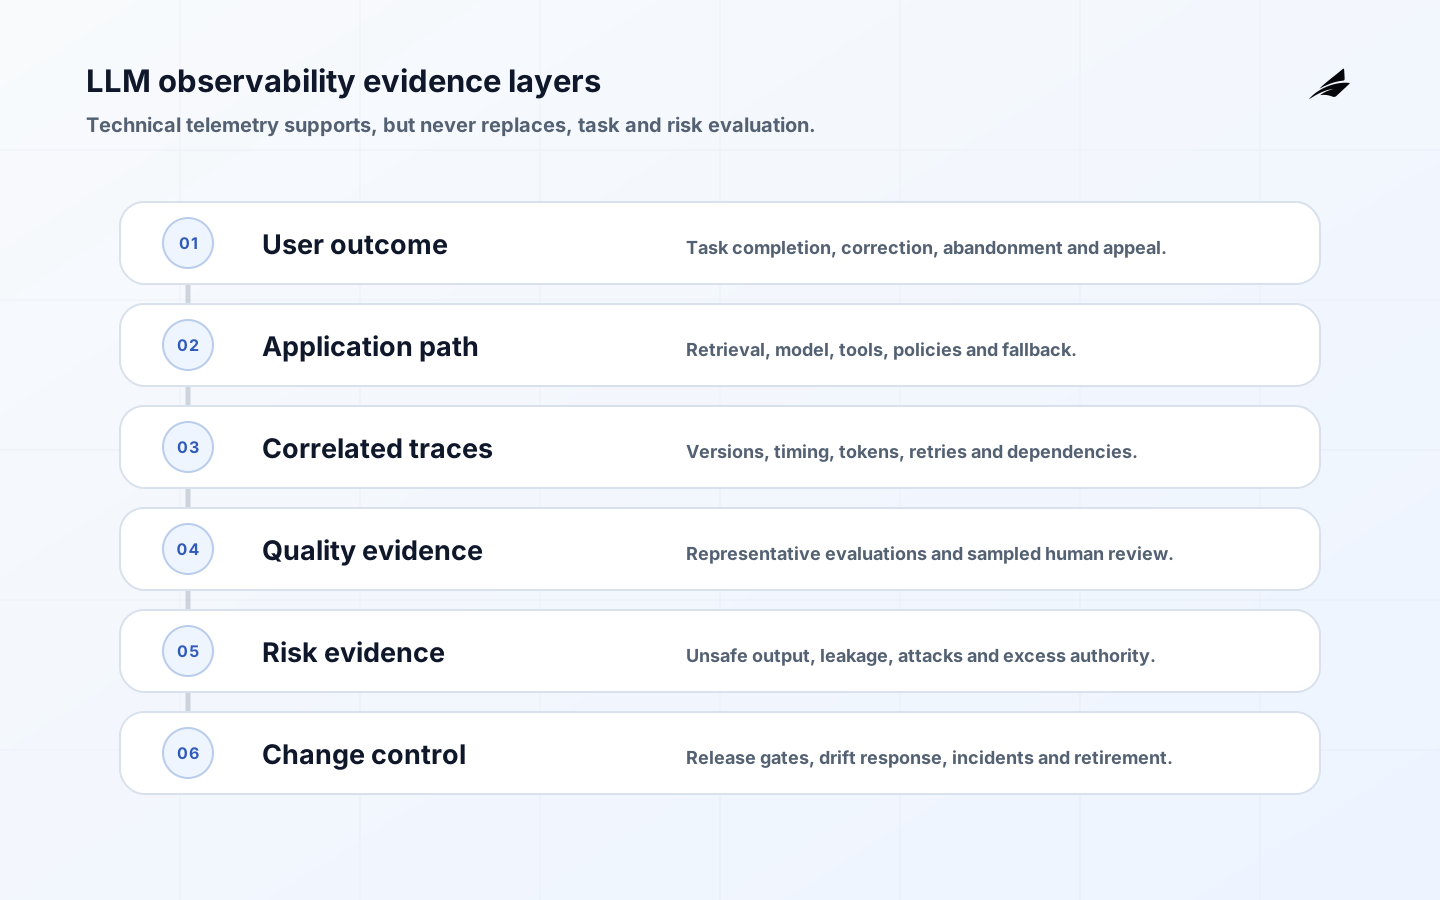
LLM observability is the evidence system for understanding an AI application's behavior in production. It must connect a user request to retrieval, model calls, tool actions, policy decisions, fallback, cost and outcome. A latency chart and token counter are useful, but they cannot tell an engineering team whether an answer was supported, a tool had too much authority or the user's task was completed.
Edilec's guides to tool calling, agent memory and MCP servers cover components that produce important telemetry. This guide shows how to join those signals without turning sensitive prompts into an uncontrolled logging lake.
Key takeaways
- Trace the application path, not only the model API call.
- Keep versions, provenance and user outcome correlated by a stable request identifier.
- Evaluate quality with representative tasks and calibrated human review.
- Treat prompts, outputs and tool results as sensitive opt-in telemetry.
- Use release gates and incident runbooks to turn observation into control.
Define the observable service boundary
Start with a service map: entry points, identity, prompt assembly, retrieval, reranking, model routing, safety policy, tools, memory, output transformation and feedback. Name external providers and regional paths. Define one trace boundary for a user task and child spans for significant operations. Long-running agents may need a workflow identifier in addition to individual traces.
Write the decisions observability must support: diagnose slow answers, compare a model release, investigate unsupported claims, attribute tool failures, control spend or respond to data exposure. Every field collected should serve a decision and have a retention owner. The NIST AI RMF frames measurement inside governance and management, which prevents teams from mistaking abundant telemetry for controlled risk.
| Evidence layer | Example signals | Primary question | Risk |
|---|---|---|---|
| User outcome | Completion, correction, abandonment | Did the task work? | Ambiguous proxies |
| Application | Route, retrieval, policy, fallback | Which path ran? | Missing versions |
| Model | Latency, tokens, finish reason | How did inference behave? | Provider-only view |
| Tools | Call, arguments, result, authority | What changed outside the model? | Sensitive payloads |
| Evaluation | Score, rubric, reviewer | Was behavior acceptable? | Uncalibrated graders |
Instrument correlated traces and metrics
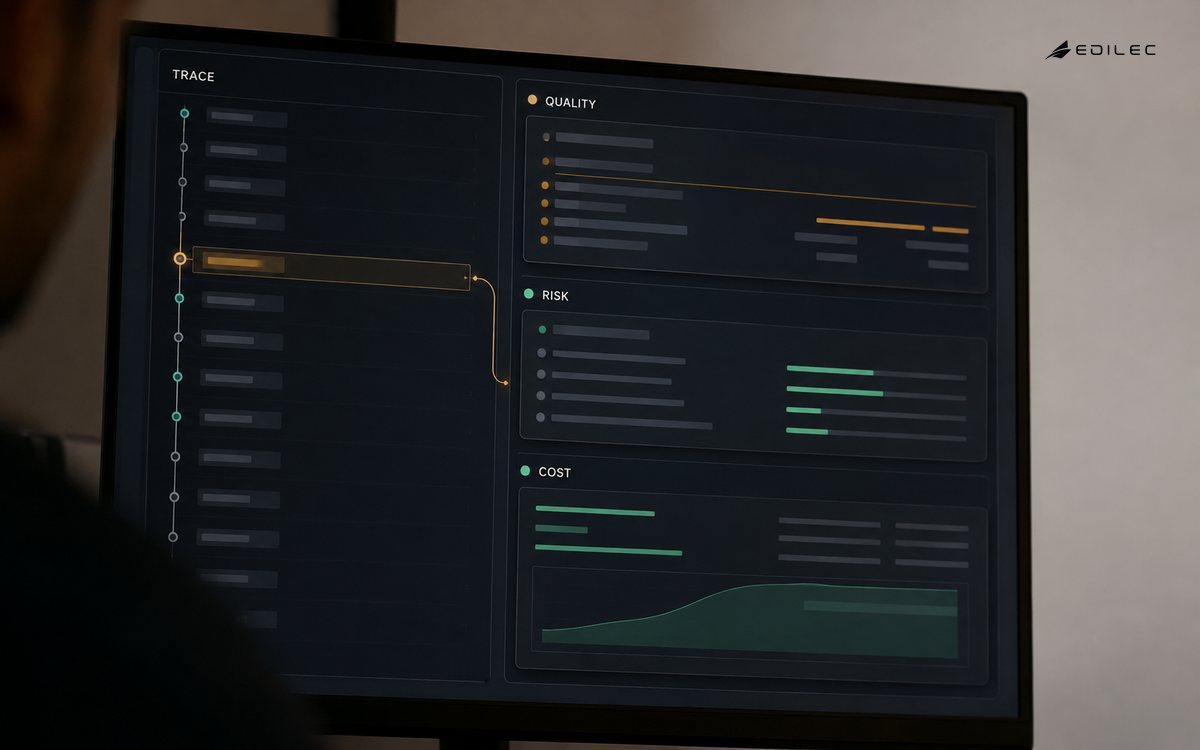
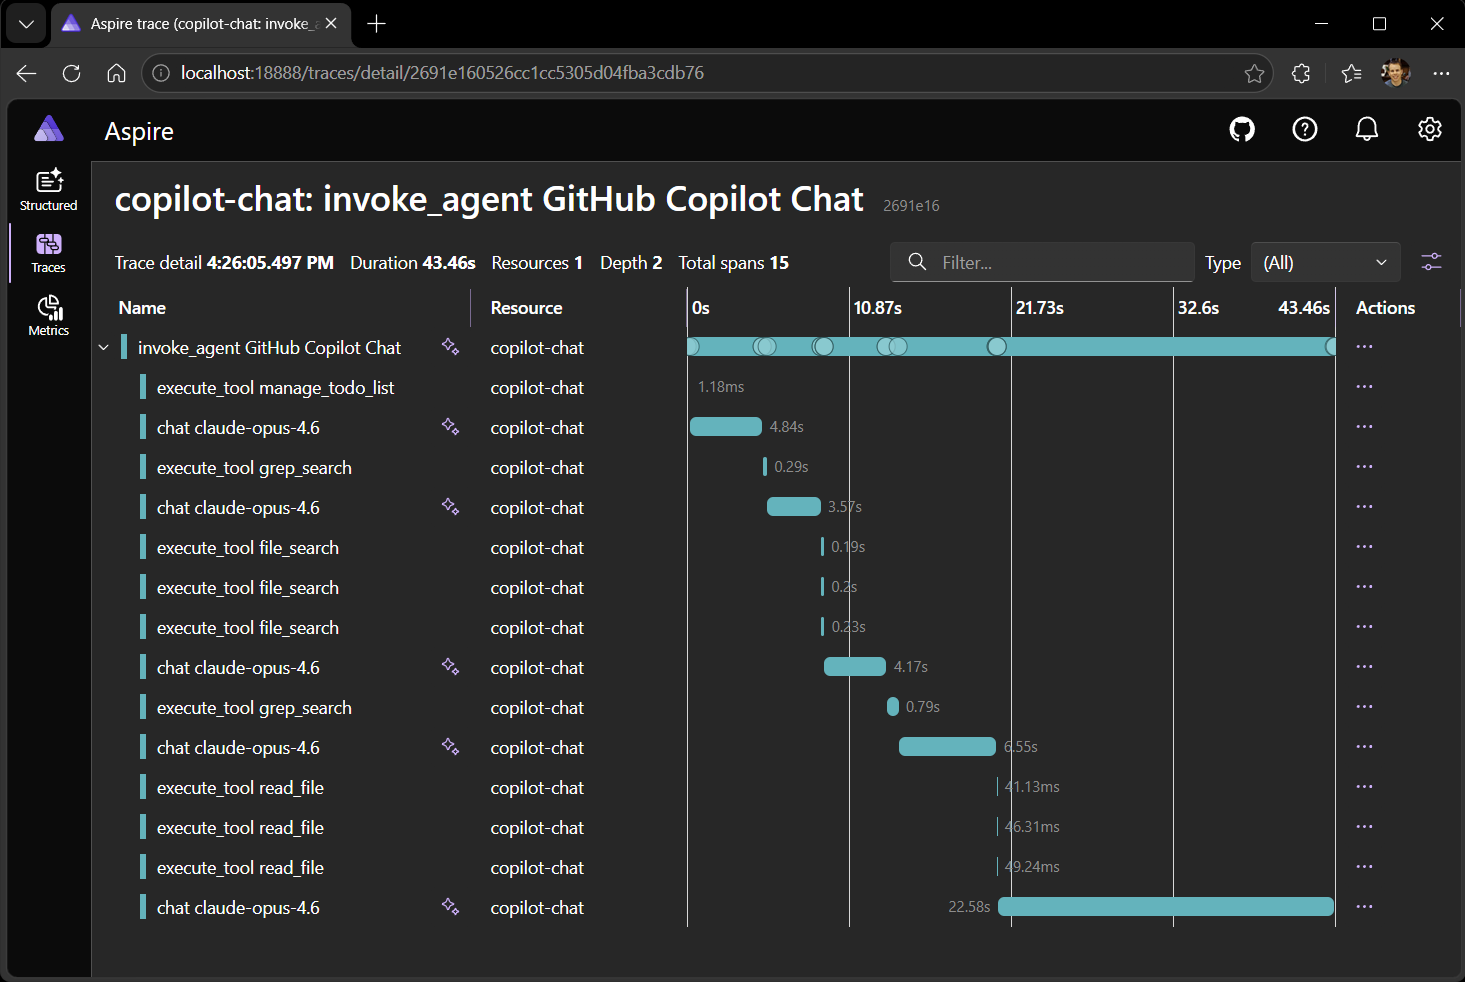
Attach service, environment, release, prompt-template, retrieval-index, model, policy and tool-schema versions to the trace. Record operation timing, retry, cache status, token usage and finish reason. Link customer-visible errors to internal spans. The OpenTelemetry semantic conventions provide shared names across telemetry domains; its generative-AI conventions are actively evolving, so pin the adopted version and isolate translation from application logic.
OpenTelemetry's 2026 GenAI observability walkthrough demonstrates traces for agent, chat and tool operations plus duration and token metrics. Use those as technical building blocks, then add application-specific outcome and policy signals. Keep metric dimensions bounded: user IDs, full prompts and document IDs create privacy, cost and cardinality problems when used as labels.
Collect content only with a protection plan
Prompts, retrieved passages, outputs and tool results can contain personal data, source code, secrets, contracts or health information. Default to structural metadata and hashes where possible. If content is needed for quality review, sample deliberately, redact before export, encrypt, restrict roles, log access and delete on schedule. Separate debugging stores from broad operational dashboards.
Preserve enough provenance to reproduce behavior without retaining everything forever: source identifiers, access decision, retrieval scores, document versions and model configuration. Do not log reusable credentials or hidden system instructions to client-visible tools. The OWASP LLM and generative-AI guidance is a useful threat-model input for injection, disclosure and excessive agency.
Join telemetry to evaluation
Define task-level rubrics for correctness, support, completeness, policy, tool choice and safe refusal. Keep a versioned offline set covering normal, difficult, adverse and out-of-scope requests. Run it before releases. In production, evaluate sampled traces, user-reported failures and high-risk events. Automated graders can scale screening, but calibrate them against qualified reviewers and preserve score version.
Measure retrieval and generation separately. A response may be faithful to irrelevant context, or correct despite poor retrieval. For tool-using systems, evaluate proposed arguments, authorization result, actual side effect and recovery. The NIST Generative AI Profile emphasizes pre-deployment testing and ongoing risk management; production sampling should complement, not replace, release evaluation.
| Signal | Alert or review trigger | Likely investigation | Guardrail |
|---|---|---|---|
| Latency | Tail exceeds service objective | Provider, retrieval, tool or retry span | Timeout and fallback |
| Unsupported output | Rate rises by release or intent | Retrieval and citation evidence | Refusal or handoff |
| Tool denial | Unexpected permission failures | Identity, scope and schema version | Least privilege remains |
| Token cost | Cost per successful task rises | Context, retries and model route | Budget and route policy |
| Safety event | Confirmed harmful or leaked content | Trace, access and policy decisions | Contain and notify |
Create service objectives and alerts
Set objectives for availability, end-to-end latency and successful task completion by critical intent. Add quality guardrails such as supported-answer rate or safe tool completion where measurement is dependable. Do not compress all behavior into one score. Segment by release, route, language, customer tier and risk class while enforcing privacy and controlling cardinality.
Page only on conditions requiring timely human action: widespread task failure, unauthorized tool attempts, sensitive-data exposure, exhausted fallback or severe cost runaway. Use tickets or scheduled review for gradual quality drift. Every alert needs a runbook, owner and tested containment. An observability platform that produces alarms without authority simply transfers uncertainty to on-call staff.
Control releases and incidents
Treat model, prompt, policy, retrieval, tool and memory changes as releases. Attach candidate versions to replay and online experiments. Compare quality, safety, latency and cost, then roll out gradually with kill switches by capability. Preserve a known-good route and account for provider-side model changes. Re-run evaluations after changes in source content or tool contracts.
Create incident categories for harmful output, data disclosure, prompt attack, excess authority, provider degradation and evaluation blind spots. Retain decision evidence and coordinate security, privacy, product and vendor response. The UK NCSC's secure AI development guidelines explicitly span secure design, development, deployment and operation; LLM observability should serve that whole lifecycle.
Worked investigation: a sudden quality regression
Users report that a support copilot cites correct documents but recommends the wrong procedure. Availability and model latency are healthy. The on-call engineer filters traces by task, release and reported failure, then compares against the prior week. Prompt and model versions are unchanged, but the retrieval index version moved and the average age of selected documents increased.
Trace samples show that a new document connector removed effective-date metadata during ingestion. Retrieval relevance scores still look plausible, so a dashboard focused on top-k scores missed the problem. Source identifiers and index versions let the team reproduce affected requests. Access logs also confirm that restricted documents were not exposed, narrowing the incident to freshness and procedure quality.
The team disables the connector's new path, restores the previous index snapshot and replays the task evaluation set. A release gate checks citation effective dates and supported-procedure accuracy before traffic returns. Customer-facing cases receive review, and the incident record links affected traces without copying full sensitive conversations into a broad ticket.
Follow-up adds metadata completeness at ingestion, document-age distributions by source, an evaluation slice for superseded procedures and an alert when the active index loses required fields. The response avoids paging on every index change; it pages when required provenance disappears or quality guardrails fail. This keeps alerts tied to action.
The example shows why LLM observability needs several layers. Model telemetry proved the provider was responsive, retrieval traces located the changed component, content provenance exposed stale evidence, evaluations quantified harm and release controls enabled rollback. No single vendor dashboard could infer the user-facing failure without those application-specific connections.
The post-incident observability review also asks which evidence was unavailable, excessively sensitive or too expensive. Engineers add fields only when they support a named query, alert or evaluation, and they remove raw content after the protected review window. The telemetry schema, redaction policy and dashboard definitions are versioned together so a metric change cannot masquerade as an application improvement.
For every high-risk capability, the team maintains a short evidence card: intended task, responsible owner, trace coverage, approved content sampling, evaluation slices, service objectives, safety triggers, tool authority and fallback. Release automation verifies required version attributes and evaluation links before deployment. During an investigation, responders can then move from an alert to representative traces and the correct runbook without guessing which prompt or policy was active.
LLM observability implementation checklist
- Trace boundary and stable correlation identifiers are defined.
- Model, prompt, retrieval, policy and tool versions are attached.
- Content telemetry has purpose, redaction, access and retention controls.
- Offline evaluations and production review use versioned rubrics.
- Objectives join technical health to task and risk outcomes.
- Release gates, kill switches and incident runbooks are tested.
Frequently asked questions
Must we store every prompt and response?
No. Collect the minimum needed for defined decisions. Structural telemetry, controlled sampling and short-lived protected review stores are often safer and cheaper than full retention.
Can an LLM grader replace human review?
No. It can triage and scale known rubrics, but it has biases and failure modes. Calibrate against reviewers and use people for high-consequence and novel cases.
Are GenAI telemetry fields stable?
The conventions are developing. Pin versions, test exporters and keep an internal semantic layer so dashboards and alerts do not break when upstream names change.
Conclusion
LLM observability helps engineering teams explain and control the entire AI workflow. Correlate traces, protect content, evaluate tasks, monitor authority and use evidence to gate change. The result is not just better debugging; it is a service whose quality, risk and cost can be managed together. Keep the evidence proportional: retain what supports diagnosis, evaluation and accountability, remove what only increases exposure, and verify that every important alert still leads to a practiced response with an accountable owner and an explicit, documented recovery decision. That discipline keeps operational evidence useful.