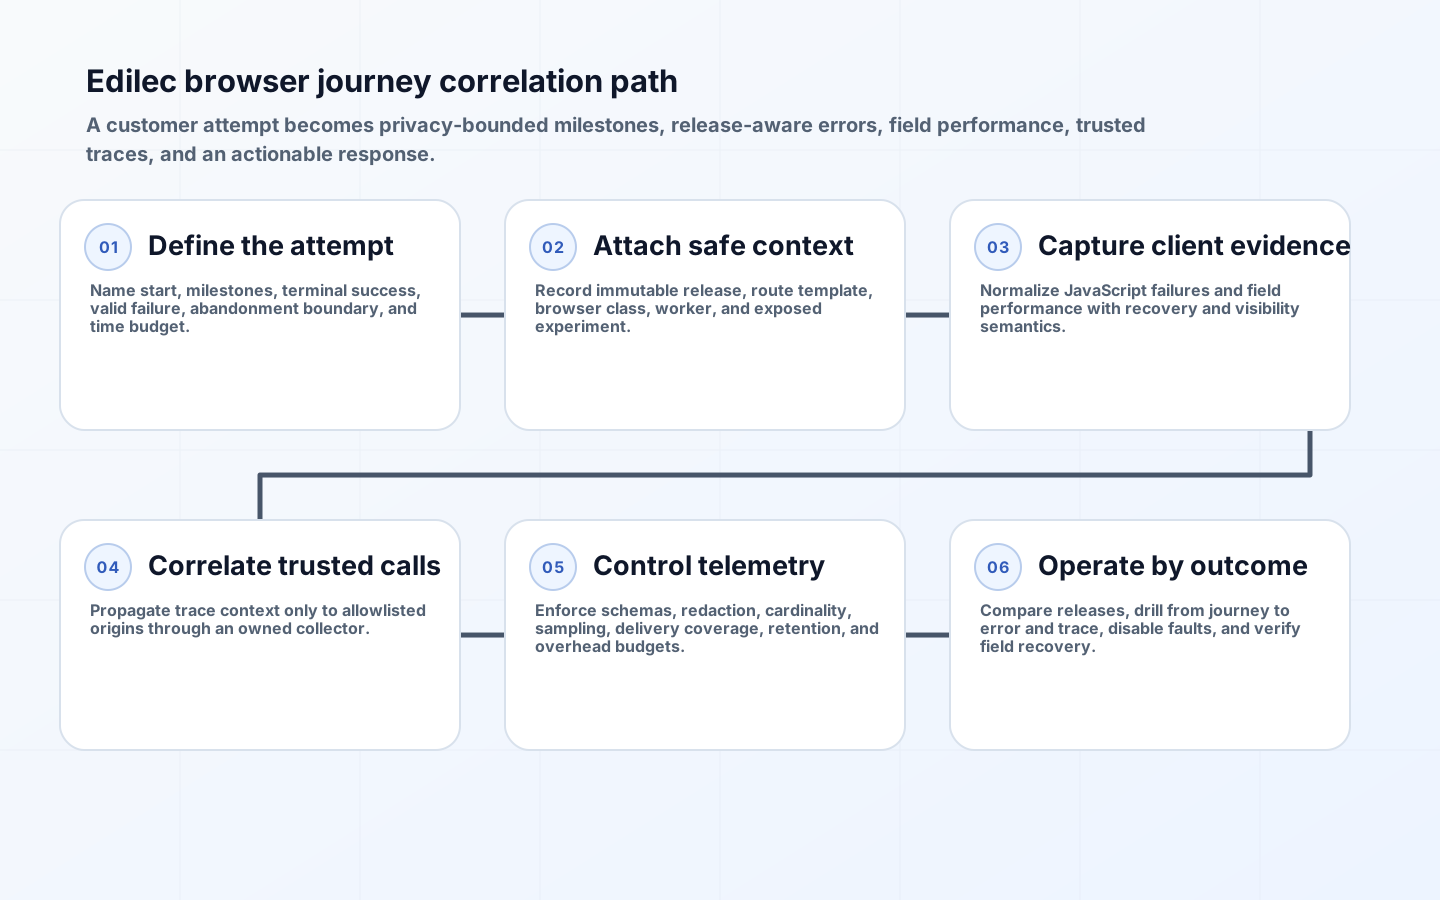
Browser journey observability explains whether customers can complete meaningful work across routes, releases, devices, networks, and backend services. Healthy API averages do not reveal a JavaScript bundle that fails only on one browser, a click that never creates a request, a hydration error, or an interaction delayed by main-thread work. Real user monitoring, errors, traces, and release metadata must meet at the journey level.
The design must also respect that the browser is an untrusted, privacy-sensitive, resource-constrained telemetry source. Delivery is best effort, extensions can alter behavior, users can block collection, and identifiers can become personal data. Collect the minimum context needed to diagnose a product outcome, sample deliberately, scrub before export, and preserve aggregate signals when an individual session cannot be followed.
Define journey service indicators before choosing instrumentation
Choose a small set of critical journeys such as sign-in, search-to-detail, checkout, document submission, or dashboard load. Mark an explicit start, meaningful milestones, terminal success, recoverable failure, abandonment boundary, and time budget. A journey may span page loads and single-page navigation, so use a generated attempt ID with a short lifetime rather than assuming one browser session equals one attempt.
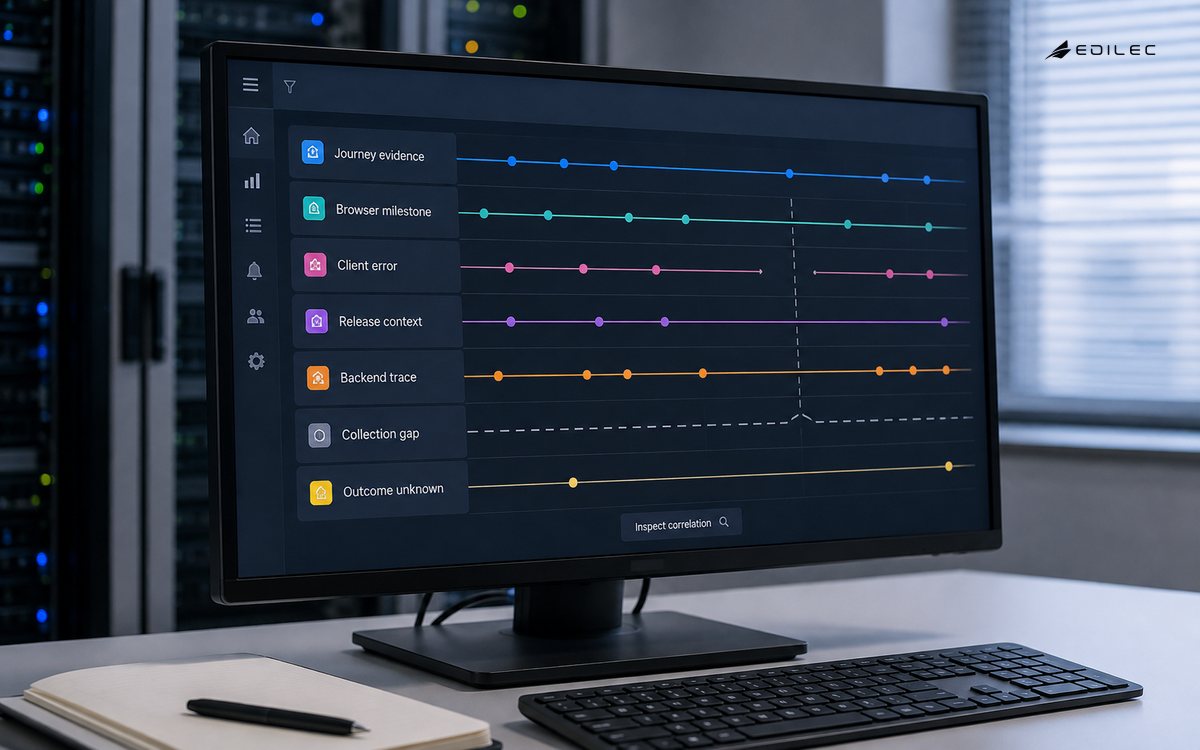
Define indicators from customer outcomes: success ratio, valid failure ratio by owned reason, duration distribution, rage or repeat action where ethically and technically justified, and affected user or session share. Segment by app release, route template, browser family, OS, device class, network class, region, and experiment with bounded cardinality. Never put raw URLs, search queries, email, account IDs, or document names in metric labels.
| Signal | Question answered | Required context | Main blind spot |
|---|---|---|---|
| Journey milestone | Where do customers stop? | Attempt, step, release, route template | Blocked telemetry looks like abandonment |
| JavaScript error | What client failure interrupted work? | Normalized error, stack, source map, release | Extensions and cross-origin scripts obscure stacks |
| Web Vital or timing | Was the experience responsive? | Metric, navigation type, visibility, device class | Fast pages can still have logical failure |
| Browser span | Where was time spent across UI and requests? | Trace ID, operation, sampled attributes | Unsampled or blocked requests break traces |
| Backend outcome | Did the authoritative operation succeed? | Trace or safe correlation ID, result class | Client may not receive the final response |
Establish immutable release, route, and experiment context
Embed an immutable build or asset manifest ID in every deployed HTML shell and JavaScript bundle. Record it with error events, spans, and journey milestones. A human version such as production or a mutable latest tag cannot map a stack to source. Upload source maps under controlled access keyed by exact artifact identity; do not serve them publicly by default. Retain enough artifacts to diagnose releases still present in browser caches.
Normalize dynamic URLs to route templates before telemetry leaves the page. Record experiment ID and assigned variant only after actual exposure. For service workers, capture worker version and whether a response came from its cache because a stale worker can create a release mixture. Include page visibility and navigation type: background tabs, back-forward cache restoration, prerendering, and hard navigation change how timings should be interpreted.
Instrument errors and field performance with clear semantics
Capture uncaught errors, unhandled promise rejections, framework error boundaries, resource load failures, and controlled domain failures as separate classes. Normalize messages to remove volatile values; symbolicate with the exact source map; group only after preserving release and top-frame evidence. Count repeated errors within one attempt without uploading every instance. Mark whether the application recovered, because a handled retry and a blank screen have different severity.
Measure field performance through supported browser APIs or a maintained library. Google's field measurement guidance emphasizes real-user data for understanding actual experiences. Record metric value and attribution with privacy review, then aggregate distributions rather than averages. Observe loading, responsiveness, and visual stability together with journey completion; improving a score while reducing conversion or accessibility is not success.
| Risk | Preventive control | Detection | Response |
|---|---|---|---|
| Personal data in URLs or errors | Route templates, allowlisted attributes, client scrubbing | Automated payload scanner and sampled review | Drop field, delete affected data, fix instrumentation |
| High-cardinality cost | Schema registry and cardinality budgets | Distinct-value alarms by attribute | Aggregate or remove dimension |
| Telemetry causes page slowdown | Async batching, size limit, sampling, unload-safe send | Instrumentation overhead budget | Disable expensive integration remotely |
| Missing or biased data | Measure send success and blocker-aware gaps | Compare server operations with client attempts | Report coverage beside indicator |
| Cross-origin trace exposure | Origin allowlist and trust-boundary policy | Header and CORS tests | Restart or suppress external trace context |
Correlate browser work with backend traces safely
The W3C Trace Context recommendation standardizes traceparent and tracestate propagation. Create browser spans for navigation, route transition, user intent, and selected fetch or XHR operations. Inject context only to allowlisted origins that participate in the trust domain and configure CORS accordingly. Do not propagate internal vendor state or personal information; the specification explicitly prohibits personal data in tracestate.
OpenTelemetry's browser JavaScript guide shows document-load instrumentation, but the project currently labels browser client instrumentation experimental and mostly unspecified. Pin compatible packages, test context propagation across the framework, and avoid assuming automatic instrumentation captures semantic user intent. Send telemetry through an owned collector endpoint that can authenticate origin, enforce schemas, redact, rate-limit, and route data without exposing backend exporter credentials.
Sample and export without erasing rare failures
Use deterministic head sampling for ordinary successful attempts so related browser spans share a decision. Retain all low-volume critical errors within a budget, and consider a compact unsampled journey outcome for aggregate reliability. Browser-only tail sampling is impractical because the final outcome is not known when early data would be sent; a collector can make later decisions only if it receives enough candidate data. Never promise complete traces where blocking or navigation can interrupt export.
Batch with size and time limits, flush opportunistically on visibility change, and tolerate duplicate delivery through event IDs. Browser reporting mechanisms are best effort; the W3C Reporting API explicitly does not guarantee delivery. Track accepted, rejected, sampled, scrubbed, oversized, and failed-export counts. Set retention by signal purpose, restrict raw-session access, and keep replay-like capture off by default unless a separate necessity and consent review approves it.
Operate release detection and incident response
Compare each release with a stable predecessor by journey, browser, and route. Alert on customer-impact changes such as failure share, no-progress attempts, severe error affected sessions, and duration regression, not raw error count alone. Link alerts to release manifest, source maps, deployment time, feature flags, and backend traces. A new error with one affected attempt may be less urgent than an old silent failure affecting a large cohort.
Give responders a drill-down path from journey indicator to release and segment, normalized error, browser span, backend trace, and safe reproduction context. Provide remote control to disable faulty instrumentation or product flags without loading more code. After resolution, verify recovery in field data and annotate the time series. Maintain synthetic tests for complete telemetry flow because a broken collector otherwise makes production look healthy by silence.
Validate telemetry as a versioned product
Define event and span schemas with owner, purpose, required fields, allowed values, cardinality limits, privacy class, retention, and version. Generate typed instrumentation helpers where practical and reject unknown fields at the collector. Test duplicate milestone emission, missing terminal event, route normalization, source-map lookup, clock behavior, offline queue limits, page unload, and consent changes. A dashboard cannot compensate for an ambiguous event contract.
Before a release, run an automated reference journey and assert the exact chain from browser milestone through collector acceptance to metric, error group, and trace lookup. In production, compare client-declared successful operations with authoritative server completions to estimate coverage and mismatch. Review instrumentation changes with feature code because renaming a step or moving a start boundary can create an apparent reliability shift even when customers experience no change.
Key takeaways
- Anchor telemetry to explicit customer journey attempts, milestones, success, and failure semantics.
- Attach immutable release, route-template, worker, and experiment context with bounded cardinality.
- Combine field performance and normalized errors with outcomes rather than treating each as a separate dashboard.
- Propagate trace context only across trusted origins and use an owned collector for schema and privacy enforcement.
- Report sampling and delivery coverage beside indicators, because browser telemetry is incomplete by nature.
FAQ
Does RUM replace synthetic monitoring?
No. RUM reveals real distributions and environment-specific failures but is variable and can be blocked. Synthetic tests provide controlled, repeatable coverage and can detect total telemetry or journey failure. Use both with clearly different claims.
Is session replay required for frontend observability?
No. Journey events, errors, timings, and traces can answer many operational questions with less privacy and storage risk. Adopt replay only for a defined gap, with minimization, masking validation, consent and regional controls, short retention, and restricted access.
Should every browser journey be fully traced?
Usually not. Full tracing can add network, CPU, privacy, and storage cost. Sample representative successes, preserve critical failures within budgets, and emit compact aggregate outcomes. Make the sampling policy visible to analysts.
Conclusion
Frontend observability becomes operationally useful when a responder can move from a degraded customer journey to the responsible release, browser condition, client error, and backend operation without collecting uncontrolled user data. Explicit journey semantics, immutable context, privacy-aware correlation, and measured coverage turn disconnected browser signals into a reliable product control.