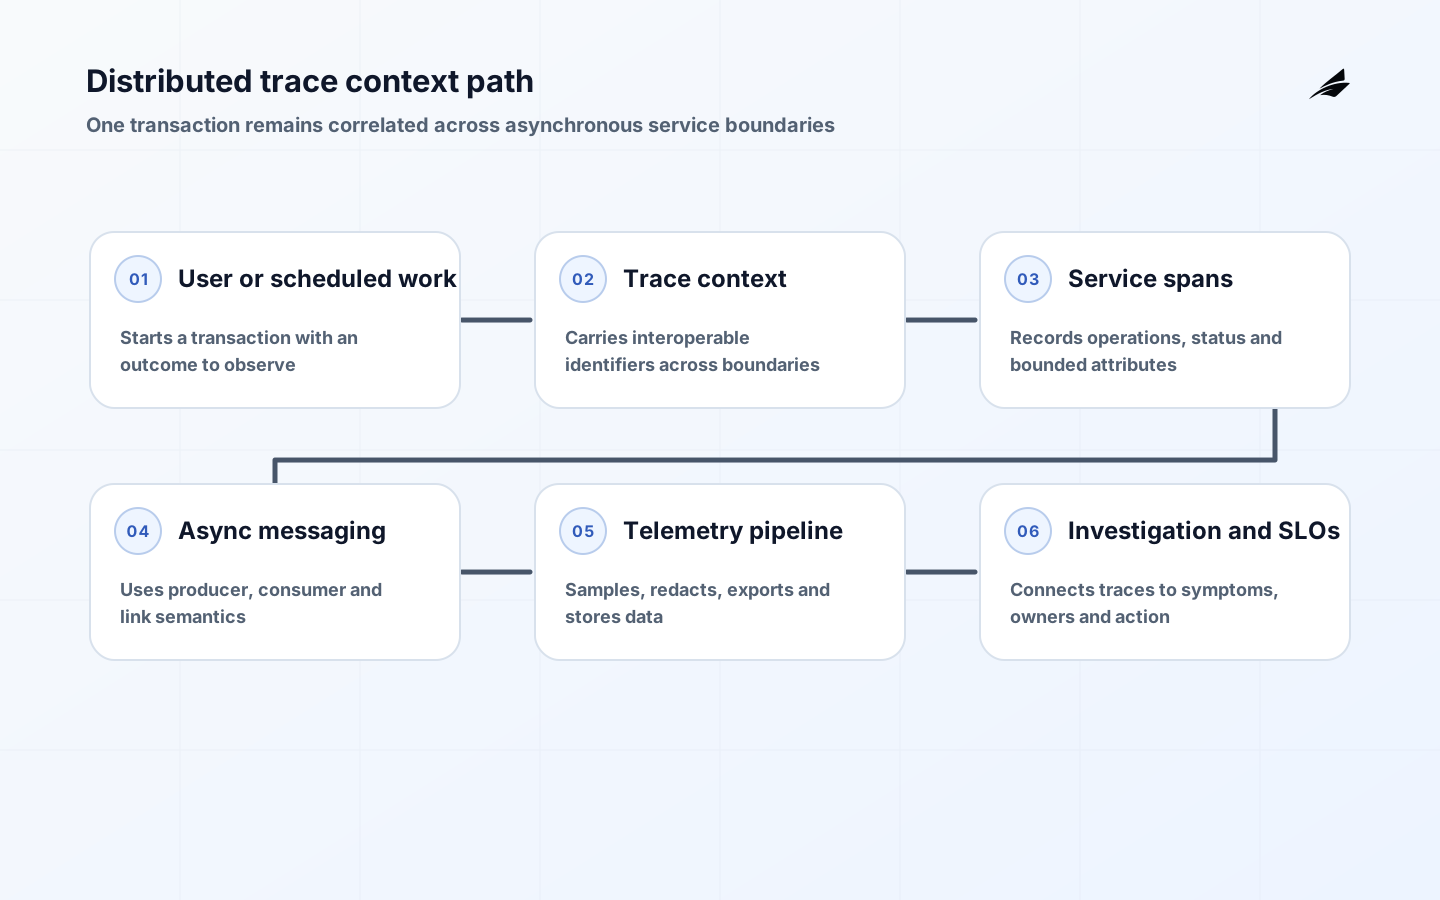
Distributed tracing is useful when a user-visible action crosses multiple services, queues or execution environments and the team needs to understand where time, failure and ownership accumulate. It is not valuable simply because a platform can draw a waterfall chart. The point is to keep one transaction intelligible as it moves through the system. When that transaction loses identity at a boundary, incident response slows down, root cause becomes guesswork and teams over-collect logs to compensate for poor causal visibility.
A good tracing design turns three questions into routine operations: where did this work begin, what path did it take, and which part of the path changed or failed? Standards matter because ad hoc identifiers collapse when requests traverse languages, vendors and asynchronous systems. W3C Trace Context and OpenTelemetry provide the common vocabulary, but the hard part is still local engineering judgment: where spans should begin and end, which attributes are worth storing, how much to sample, what to redact and how traces connect to ownership and service objectives.
Start from the questions operators need answered
Before instrumenting everything, list the questions a responder must answer under pressure. Which customer action slowed down? Which downstream dependency added the delay? Which retry loop amplified cost? Which queue introduced backlog? Which release changed behavior? If the tracing program cannot answer those questions faster than log searching can, it is probably capturing the wrong spans or the wrong attributes. Question-first design also keeps the team honest about scope: tracing an internal batch job and tracing a user checkout flow are different observability problems.
This question set should reflect both product and platform concerns. Product teams need to know whether a user reached useful completion. Platform teams need to know whether latency came from network hops, database calls, rate limits, serialization or retries. Security and compliance leads may need proof that sensitive attributes were not sprayed across telemetry sinks. Good distributed tracing accepts that one trace can serve several audiences, but only if the semantics are defined intentionally instead of being inherited from library defaults.
Define the trace model before instrumenting services
A trace model declares what counts as one transaction, which boundaries create child spans, how asynchronous work is linked, and which identifiers survive retries or fan-out. At minimum, the team should decide the entry points to trace, the business key or correlation handle that may be safely attached, the services that must propagate context and the conditions under which a span is considered failed. OpenTelemetry's trace model is flexible enough to support many shapes, but flexibility without local rules usually produces traces that are technically connected yet semantically confusing.

Asynchronous systems deserve special attention. A message consumer may process work long after the originating request has ended, and several consumers may contribute to the same business outcome. Use links and clear producer-consumer boundaries where parent-child relationships would misrepresent causality. Equally important, decide how to represent retries, deduplication and compensating actions. A trace should help responders explain what happened, not accidentally suggest a clean linear request path where the real system used fan-out, buffering and repair logic.
| Design decision | Question to answer | Why it matters |
|---|---|---|
| Trace boundary | What business action counts as one observable transaction | Prevents traces from becoming arbitrary request fragments |
| Span granularity | Which operations deserve their own spans | Balances diagnostic value against overhead and noise |
| Async linkage | How producer, consumer and batch work stay related | Keeps causal paths visible across queues and schedulers |
| Failure semantics | When a span should be marked error or retry | Makes status useful during incidents |
| Attribute policy | Which fields are safe and meaningful to attach | Protects privacy and limits cardinality |
| Ownership mapping | Which team owns each span namespace or service name | Routes investigation to the right responders |
Use semantic conventions and attribute discipline
Semantic conventions matter because a trace is only as useful as the shared meaning of its fields. Stable service names, operation names, status codes, peer information, database system attributes and messaging attributes allow teams to compare traces across services and tools. Without conventions, every dashboard becomes a translation exercise. The tracing system may still function, but investigators spend their time deciphering labels instead of isolating the problem. OpenTelemetry's semantic conventions do not replace local vocabulary; they provide the interoperable baseline on top of which domain-specific meaning can be added.
Attribute discipline is equally important. High-cardinality values, secrets, full payloads and uncontrolled identifiers can make traces expensive, noisy or unsafe. Attach only what helps answer known questions, and define redaction or hashing rules before production traffic flows. Product identifiers, cohort labels or workflow states can be extremely useful when bounded and reviewed. Raw free-text prompts, document bodies or personal data usually are not. The tracing design should specify what belongs in spans, what belongs in logs and what should never leave the application boundary at all.
Choose sampling and storage based on decisions, not habit
Complete tracing is rarely necessary or economical. Sampling is a policy decision about which evidence must survive for which purposes. Head sampling is cheap and predictable, but it can miss rare failures that become visible only later in a request path. Tail or rule-based sampling preserves more diagnostic value for slow or failed traces, but it increases pipeline complexity and may delay export. The right answer depends on traffic shape, incident patterns, latency tolerance and budget. What matters is that the team can explain why the current sampling policy is good enough for the questions it relies on traces to answer.
Storage and retention should follow the same logic. Keep enough history to investigate recurring issues, compare releases and understand representative outliers, but do not hoard telemetry because cheaper storage was available this quarter. Tie retention and indexing to use cases such as incident forensics, capacity review or SLO analysis. Cost control is not anti-observability. It is part of keeping the tracing system sustainable so it remains trusted when a difficult incident arrives.
| Sampling choice | Best fit | Trade-off to manage |
|---|---|---|
| Low-rate head sampling | High-volume services where broad trends matter | Rare failures may be missed |
| Rule-based head sampling | Known critical routes or premium workflows | Rules can become stale or incomplete |
| Tail sampling | Need to keep slow, errored or anomalous traces | Collector complexity and delayed decisions |
| Burst or incident sampling | Active investigation of a suspected problem | Short-term cost spikes and operational coordination |
| No sampling for a bounded flow | Low-volume, high-consequence transactions | Higher steady-state storage and privacy review |
| Adaptive sampling mix | Large estates with diverse traffic patterns | Requires governance to stay understandable |
Handle queues, retries and batch work honestly
Distributed systems often spend more time in queues, waiting for retries or executing batch windows than they do on direct synchronous calls. If the trace model ignores those delays, teams will systematically misdiagnose bottlenecks. Represent queue publish and consume steps distinctly. Capture retry count and reason in a controlled way. Record when work was delayed intentionally versus when it stalled. For batch jobs, consider the job run, partition or record group that matters operationally instead of forcing every internal step into one enormous trace.
It is also important to decide how traces should relate to idempotency and replay. A replayed message may share business identity with the original event but deserve a distinct execution trace. A compensation flow may be part of one user outcome while still needing separate operational visibility. These are modeling choices, not library defaults. If teams leave them implicit, they usually discover the ambiguity during an outage, when the tracing system shows several plausible stories and none of them clearly explain which execution actually changed state.
Connect traces to SLOs, logs and ownership
Tracing is not a replacement for logs, metrics or service objectives. It becomes useful when it joins them. Metrics tell you that latency or error budget is worsening, traces show which path is responsible, and logs provide local detail when a specific span requires deeper inspection. Service names and trace namespaces should therefore map cleanly to ownership and to the reliability measures the organization already uses. If a trace identifies the slow span but nobody knows who owns that service or what good performance looks like, the instrumentation is ahead of the operating model.
Review tracing during normal change work, not only after incidents. Ask whether the most recent release made traces easier or harder to interpret, whether a new dependency propagated context correctly, and whether responders had the attributes they needed. Over time, good tracing design reduces investigative guesswork, shortens escalation chains and makes post-incident reviews more factual. Bad tracing design adds another dashboard without reducing uncertainty.
Roll out tracing with a narrow, owned path first
- Choose one important transaction that already causes support or incident pain.
- Define the trace model, propagation rules, attribute policy and ownership boundaries for that path.
- Instrument entry points, key services, one asynchronous boundary and one storage dependency.
- Verify trace continuity, redaction, cost and sampling behavior before broadening coverage.
- Train responders to use traces alongside logs, metrics and release identifiers.
- Expand only when the first path produced faster diagnosis or clearer post-incident evidence.
This narrow-path rollout is important because tracing quality is easier to inspect on a representative workflow than across an estate. It also forces the organization to prove that a trace can survive real production boundaries and answer real operator questions. Once that discipline exists, expanding coverage becomes a product of repeatable design choices rather than a sprawling instrumentation campaign.
Key takeaways
- Design tracing from operator questions, not from tool availability.
- Define the trace model before instrumenting services and queues.
- Use semantic conventions and attribute discipline to keep traces interpretable and safe.
- Choose sampling based on diagnostic decisions and cost, not habit.
- Represent asynchronous work, retries and replay honestly.
- Tie traces to service ownership, logs, metrics and SLO review.
Frequently asked questions
Does every service need distributed tracing?
No. Trace the paths where cross-service causality matters. Some small or stable services may be better served by logs and metrics alone. Start where responders genuinely lose time because request context disappears across boundaries, then expand deliberately.
How much request data should be attached to spans?
Only enough to answer the questions the trace is meant to support. Prefer bounded identifiers, workflow states and reviewed tags over payload copies or personal data. Define redaction rules early and treat attribute selection as a security and privacy decision, not just an observability convenience.
Can traces replace logs?
No. Traces show path and timing; logs still provide local detail and domain-specific explanation. The goal is correlation, not substitution. A mature operating model uses traces, logs and metrics together to move from symptom to cause quickly.
What is the right sampling rate?
There is no universal rate. Choose a policy that preserves enough evidence for your high-value or high-risk paths while staying within collection and retention budgets. Revisit the choice when traffic patterns, incident types or operational questions change.
Conclusion
Distributed tracing pays off when it preserves the story of one transaction across the boundaries where support teams usually lose context. That requires explicit trace modeling, disciplined attributes, thoughtful sampling and direct ties to ownership and reliability work. When those pieces are present, traces stop being decorative waterfalls and become part of the organization's normal incident and improvement machinery.