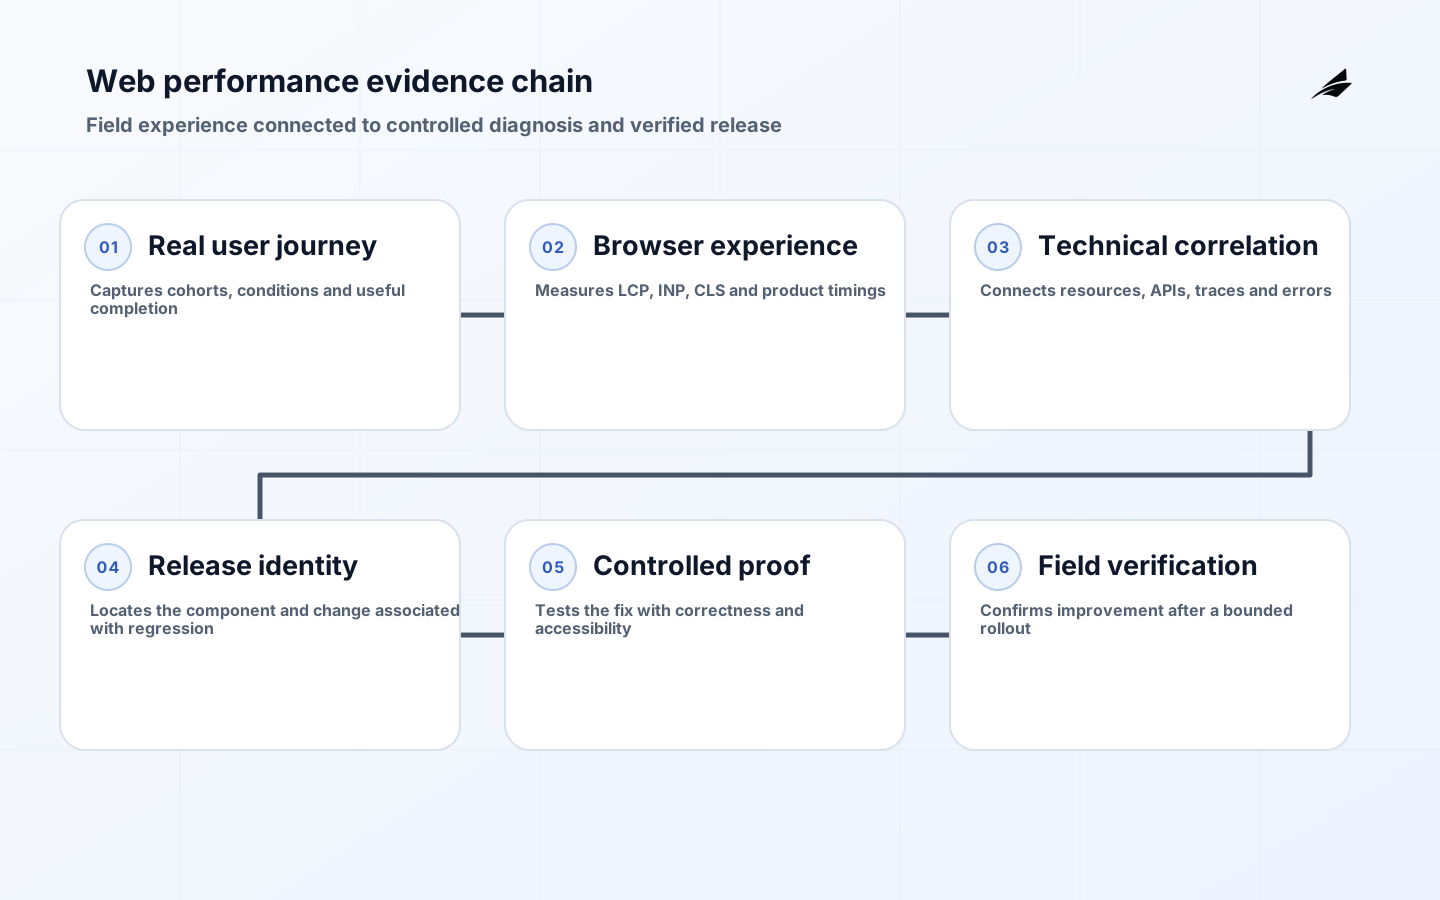
Web app performance planning is the discipline of deciding which user experiences must feel fast, how that experience will be measured, which technical budgets protect it, and who acts when it regresses. It is not a final optimization sprint. Product choices about media, personalization, analytics, component libraries, third-party scripts and workflow depth create performance behavior long before a profiler is opened.
A useful plan combines field data from real users, controlled lab tests, backend and browser telemetry, accessibility checks, release controls and business context. Product leaders do not need to tune JavaScript runtimes themselves, but they must make tradeoffs explicit. When every feature is urgent and performance has no owner or acceptance criterion, the application gradually taxes every visit.
Start with journeys, populations and conditions
Identify a small set of consequential journeys: landing and sign-in, search, dashboard load, form completion, checkout or another product-specific path. Break each journey into page views and interactions, including authentication redirects, error recovery and return visits. Record what the user is waiting to see or do. A page can render a shell quickly while the decision-enabling data remains blocked; a product measure should reflect the useful state, not whichever timestamp is easiest to collect.
Segment by conditions that change experience: page template, device class, browser, geography, network, account size, new versus returning visit and release version. Avoid publishing a single average. Latency distributions are skewed, and an aggregate can hide a cohort harmed by a change. Use privacy-respecting dimensions with minimum cohort sizes and retention rules; performance telemetry should not become an uncontrolled record of user behavior or sensitive form data.
| Planning question | Example decision | Evidence |
|---|---|---|
| Which journey matters? | Invoice review from dashboard to approval | Journey map and business owner |
| What is useful completion? | Rows visible, totals reconciled and controls enabled | Custom timing mark and user test |
| Whose experience counts? | Supported mobile and desktop cohorts in served regions | Field-data segmentation |
| What can vary? | Account size, cache state and network condition | Workload scenarios |
| What is unacceptable? | Slow interaction, unstable layout or failed task | Budget and correctness gate |
| Who responds? | Owning product team with platform support | Alert route and regression playbook |
Use a layered performance measurement model
Core Web Vitals provide interoperable experience signals. Largest Contentful Paint represents loading of the largest relevant viewport content, Interaction to Next Paint represents responsiveness across user interactions, and Cumulative Layout Shift represents visual stability. The web.dev guidance recommends assessing these from field data at the 75th percentile, separated for mobile and desktop, using the published good, needs-improvement and poor ranges. Treat those thresholds as common experience guidance, not a complete product service objective.
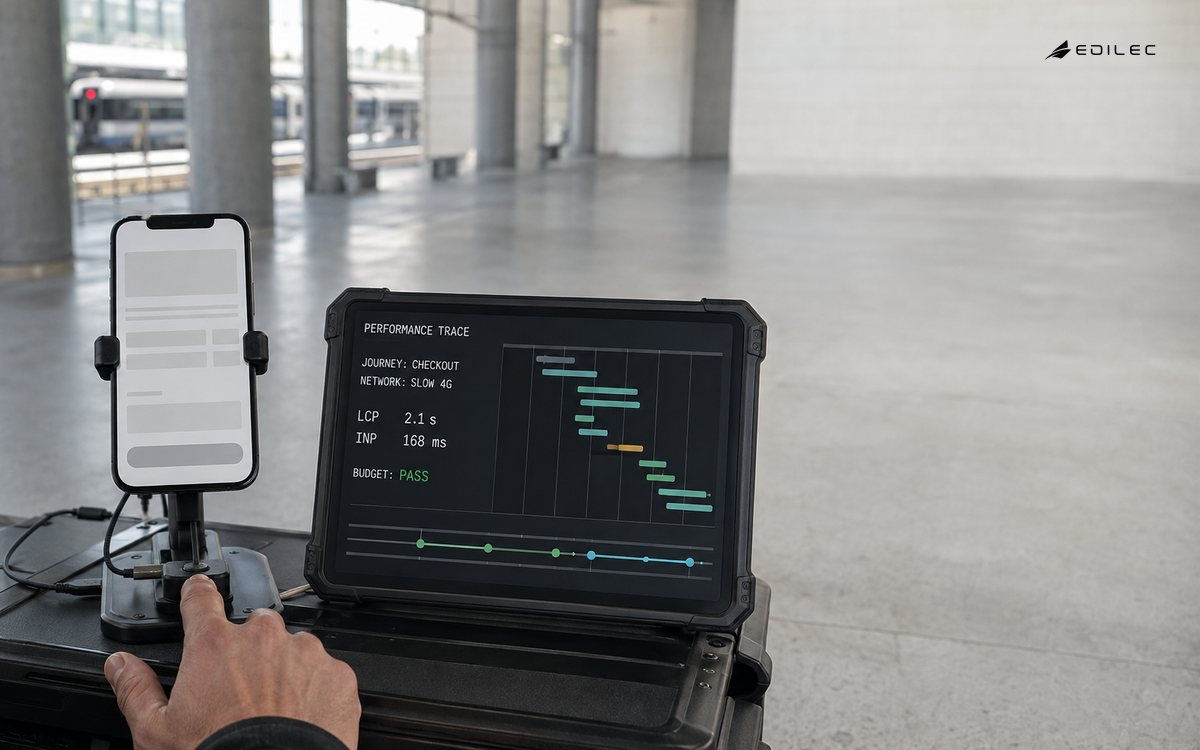
Add product timings for states the browser cannot infer: results ready, document preview usable, editor synchronized or transaction confirmation displayed. Pair client measurements with navigation timing, resource timing, errors, API latency, cache status, server traces and release identifiers. This creates a causal path from a harmed cohort to a page, resource, backend operation and change. Never infer that a backend is healthy merely because its average latency is low; the browser may still wait on sequential calls, main-thread work or rendering.
| Signal | What it reveals | What it does not prove |
|---|---|---|
| LCP | Loading experience for a prominent content element | That the complete journey is usable |
| INP | Interaction responsiveness across a page visit | That an action produced the correct result |
| CLS | Unexpected visual movement | That the interface is accessible |
| Custom product mark | Time to a domain-specific useful state | Why the delay occurred |
| Synthetic test | Repeatable behavior under a controlled setup | The distribution experienced by all users |
| Real-user monitoring | Actual cohort and release outcomes | A controlled causal experiment by itself |
Set budgets that guide design and delivery
A performance budget is a constraint attached to a journey or asset, such as field responsiveness, lab LCP under a defined profile, initial JavaScript transfer, image weight, main-thread blocking or API percentile. Establish the baseline before setting a target. Choose a small set that traces to user experience and can be enforced. An arbitrary bundle-size limit can encourage moving code to a later chunk without improving the task; an experience budget plus resource diagnostics makes the tradeoff visible.
Apply budgets at several points. Design review should challenge heavy media, web fonts, embedded tools and interaction patterns. Pull requests can compare bundle and controlled journey results with a stable baseline. Pre-release tests can exercise representative pages against production-like data. Field monitoring closes the loop after rollout. Allow documented exceptions with an owner, expiry and measured rationale; silent threshold increases simply convert a budget into decoration.
Design the critical rendering and interaction paths
Map the path from navigation to useful content: DNS and connection, HTML response, critical styles, fonts, images, scripts, data dependencies, rendering and hydration. Remove accidental serial work. Cache stable assets with versioned URLs; choose server, static or client rendering according to freshness, personalization and operational needs. Reserve dimensions for images and dynamic regions to limit layout shifts. Prioritize the actual LCP resource and avoid making essential content wait behind nonessential client code.
For interaction responsiveness, reduce long main-thread tasks, split computation, avoid excessive rendering work and keep event handlers bounded. Large datasets need pagination, virtualization or progressive disclosure designed around the user's decision. Move suitable work off the main thread, but account for transfer and synchronization. Third-party scripts deserve explicit inventory, owner, purpose and loading policy because their code and network behavior sit outside normal release control. Test degradation when analytics, chat or tag services are slow.
Test representative states without confusing lab and field data
Lab tools provide repeatability and rich diagnostics. Define browser, hardware or throttling profile, cache state, data fixture, location, authentication state and test variance. Run enough samples to recognize noise, retain raw results and compare like with like. Synthetic monitoring can continuously test a critical path from controlled locations. Neither method represents every real device, network, account or interaction, so use field telemetry to validate whether changes help the served population.
Field data also needs discipline. Record metric attribution where supported, application and release version, page lifecycle and a privacy-approved set of dimensions. Prefer distributions and cohort comparisons over individual traces for product reporting. Investigate regressions by reproducing a representative affected state, then confirm the fix in a bounded rollout. Public Chrome UX Report data can give origin or URL-level context when eligible, while first-party monitoring can connect measurements to product-specific states; their populations and collection rules differ.
Plan backend, network and third-party dependencies together
Many web performance regressions are created outside the JavaScript bundle. A page can satisfy a frontend transfer budget yet still feel slow because authentication redirects, cache misses, serialized API calls or large query responses delay the useful state. Map which server responses are required for first meaning, which can stream later, and which can be prefetched or cached safely. Give APIs their own percentile objectives and payload budgets, because a responsive interface cannot compensate for backend fan-out or an unbounded query path.
This dependency view should include CDN behavior, personalization, feature flags, search indexes and database access patterns. Product teams often discover too late that a new dashboard card or comparison view depends on several services owned by different groups, each with its own latency distribution and failure modes. Planning the end-to-end journey exposes where work can happen in parallel, where a stale-but-safe fallback is acceptable, and where a blocking dependency deserves platform investment before more features are attached to it.
| Dependency layer | Common symptom | Planning response |
|---|---|---|
| Authentication and session setup | First view waits on redirects or token refresh | Measure the full signed-in journey and reduce repeated handshakes |
| API aggregation | The shell appears but useful data arrives late | Set per-endpoint budgets, parallelize where safe and expose loading ownership |
| Third-party services | Tags, chat or experimentation code competes with core work | Inventory providers, defer nonessential work and test degraded behavior |
| Caching and CDN rules | Repeat visits stay expensive or become stale unpredictably | Version assets, set explicit cache headers and verify invalidation paths |
| Search or database calls | Interactive filters stall under large accounts | Bound result size, paginate deliberately and benchmark representative tenants |
| Network geography | A remote cohort is consistently slower | Place critical services closer to users or reduce round trips |
Make performance a release and portfolio decision
Performance planning also shapes procurement and release governance. A new analytics SDK, support widget, design-system dependency or personalization layer should enter through the same review path as a code change, with a named owner, expected user value and measurable budget impact. This protects teams from silent drift in page weight and main-thread work. It also forces a useful question before adoption: does the new dependency improve the target journey enough to justify the cost it imposes on every visit?
Treat performance exceptions like any other controlled risk. Record why a budget is exceeded, which cohort is affected, what mitigation is scheduled and when the exception expires. During rollout, compare performance distributions alongside error rates and task completion, not after the release has fully propagated. Platform teams can reduce repeated debate by shipping defaults such as image policies, tracing on key API paths, CI budget checks and dashboards that break down field percentiles by release. When regressions become visible only after users complain, the organization is choosing rework and lost trust as its normal feedback loop.
Run performance as a product operating loop
- Baseline: measure priority journeys in field and lab; document gaps and affected cohorts.
- Budget: agree experience and resource constraints with product, design and engineering owners.
- Diagnose: connect browser entries to assets, main-thread work, API calls and backend traces.
- Prioritize: rank work by user harm, reach, confidence, implementation cost and strategic relevance.
- Prove: compare controlled results and verify correctness, accessibility and resilience.
- Release: use a canary or limited cohort, watching performance distributions and error signals.
- Sustain: review regressions, third-party changes, dependency growth and budget exceptions on a regular cadence.
| Failure mode | Early signal | Response |
|---|---|---|
| Average hides a slow cohort | Stable mean but poor upper percentiles | Segment and review distributions |
| Lab-only optimization | Synthetic score improves while field does not | Check population, state and bottleneck mismatch |
| Metric gaming | Asset moves later but task remains slow | Gate the complete journey |
| Third-party drift | Unowned scripts or request growth | Inventory, budget and isolate providers |
| Telemetry overload | High collection cost or sensitive payloads | Sample, minimize and govern fields |
| Short-lived improvement | Regression follows feature releases | Add ownership and automated gates |
Key takeaways
- Plan performance around complete user journeys and useful states.
- Use Core Web Vitals with product timings, correctness and accessibility evidence.
- Review percentiles and cohorts rather than one site-wide average.
- Make budgets enforceable across design, build, release and field operation.
- Connect browser experience to resources, APIs, traces and release versions.
- Treat third-party code and telemetry collection as governed product dependencies.
Frequently asked questions
Is a perfect lab score the goal?
No. Lab scores are useful diagnostics under a stated profile. The goal is an acceptable, reliable experience for the intended population and journey. Verify field distributions, product completion, correctness and accessibility rather than optimizing one run.
Should every page use the same performance target?
Use common organization-wide guardrails where helpful, but define journey-specific objectives. A marketing page, dense authenticated dashboard and real-time editor have different useful states and constraints. Any difference should be explicit and evidence-based.
Does real-user monitoring replace synthetic testing?
No. Field monitoring shows actual distributions but has variable conditions and less experimental control. Synthetic and lab tests provide repeatability and diagnostics. Together they support detection, reproduction, explanation and verification.
How often should performance be reviewed?
Automated checks belong in normal delivery, field alerts should operate continuously, and product teams should review trends and exceptions on a regular cadence. Rebaseline after major architecture or audience changes, while retaining historical comparisons.
Conclusion
Performance becomes manageable when it has a product definition, evidence model and owner. Choose consequential journeys, measure real populations, establish budgets before expensive choices harden, and connect browser signals to the systems and releases that created them. The result is not merely a faster score; it is a web application whose responsiveness can be protected as the product evolves.