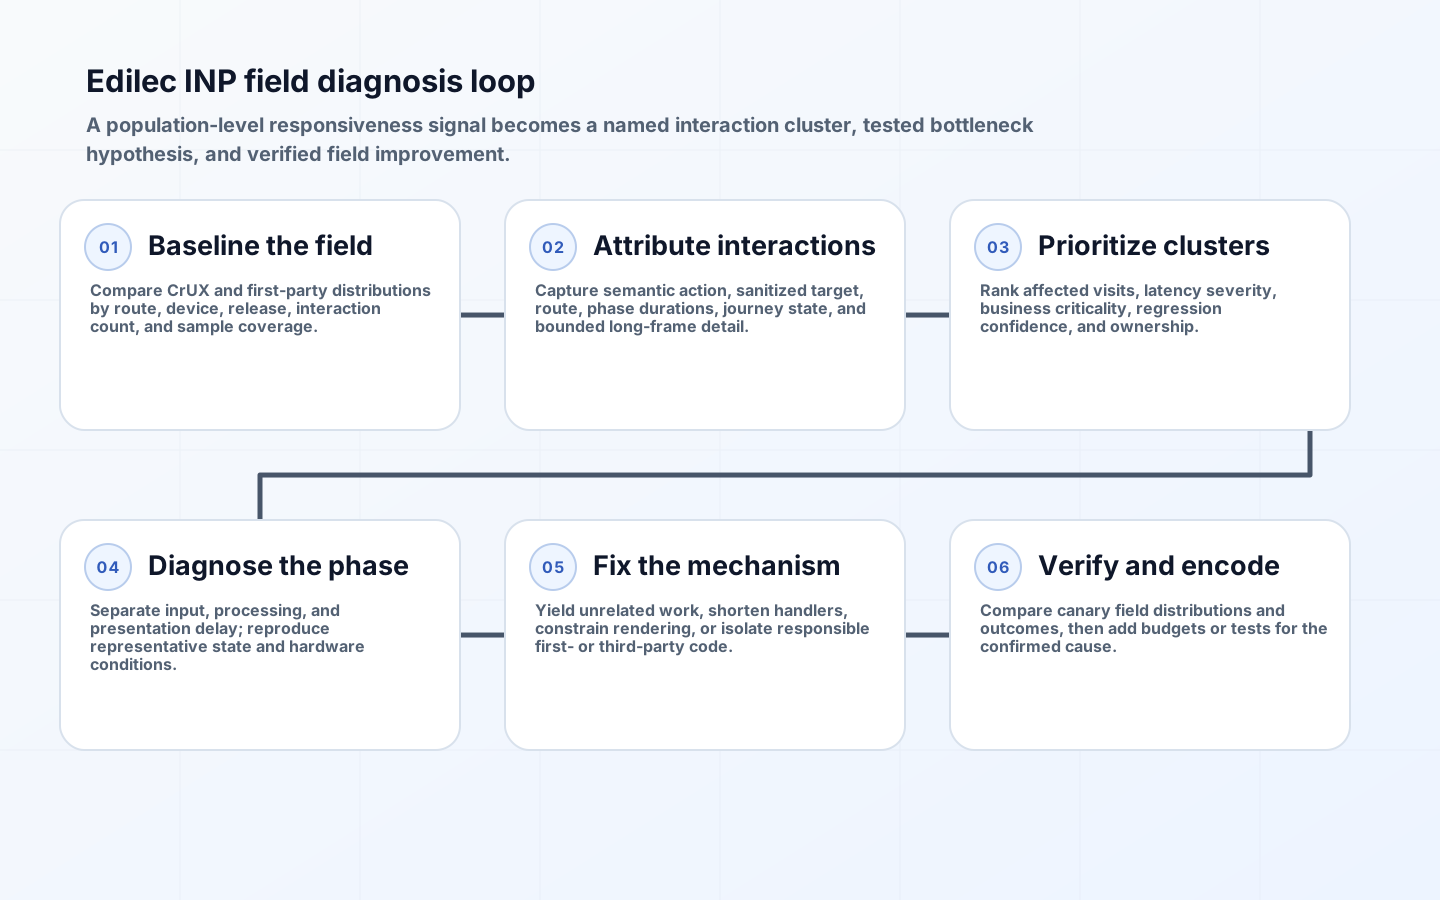
To optimize INP with field data, find the real interaction paths that keep users waiting, not just a slow aggregate score. A lab test may load a route and click one obvious button on a fast development machine. Production users open long-lived tabs, interact during hydration, use large tenant datasets, encounter experiments and third-party scripts, and repeat workflows on constrained devices. Those conditions determine responsiveness.
Interaction to Next Paint measures latency from a click, tap, or keyboard interaction until the browser can present the next frame. It includes input delay, event-handler processing, and presentation delay. The improvement workflow therefore needs interaction target and type, page and journey context, phase breakdown, responsible script or rendering work, and outcome. A percentile alone tells the team that a problem exists, not what to change.
Understand what the INP field signal represents
The current web.dev INP guide identifies INP as a stable Core Web Vital based on the Event Timing API. It observes interactions through a page visit and usually reports the slowest, while ignoring one highest interaction for every 50 interactions on highly interactive pages. Site assessment uses the 75th percentile of page views. This makes INP a visit-level responsiveness signal, not an average event-handler duration.
| Phase | Measured interval | Frequent cause | First diagnostic |
|---|---|---|---|
| Input delay | Input until event handling begins | Long tasks, startup work, competing callbacks | Main-thread activity before handler |
| Processing duration | Event callbacks for the interaction | Large synchronous handler, framework update, JSON work | Handler and Long Animation Frame attribution |
| Presentation delay | Handlers complete until next paint | Style, layout, rendering, requestAnimationFrame work | Rendering timestamps and DOM scope |
| Whole interaction | Input through next paint | Several moderate phases compound | Compare phase share, not only total |
| Visit-level INP | Representative worst interaction in visit | Rare path, late session state, repeated UI | Journey and target distribution |
| Origin percentile | 75th percentile across field visits | Device, route, cohort, or release mix | Segment distributions and coverage |
No INP value does not mean zero latency. A visit with no qualifying click, tap, or keyboard input has no INP. Scroll and hover are not part of the metric. Track measurement eligibility and interaction counts so a release that reduces interaction capture or changes navigation behavior does not appear to improve responsiveness by removing observations.
Establish an origin and route baseline
Use Chrome User Experience Report data to determine whether an origin or eligible URL has a population-level issue, split by mobile and desktop. CrUX is useful for trend and ecosystem comparison but lacks your business interaction names and application state. Pair it with first-party real user monitoring that can attribute interactions to stable, privacy-reviewed identifiers.
Compare rolling distributions before and after releases, and retain sample count. Segment by route template, interaction name, device class, effective connection, browser major version, geographic latency group, authentication state, application version, experiment, and coarse dataset-size bucket. Do not create high-cardinality raw CSS selectors or user IDs in metrics. Keep detailed diagnostic events sampled in a controlled store.
Instrument interaction-level attribution
| Field | Why it matters | Cardinality control | Privacy control |
|---|---|---|---|
| Interaction name | Maps latency to a product action | Developer-defined enum | No user content |
| Target signature | Finds component or control | Sanitized component and role | Strip text and dynamic IDs |
| Route template | Groups equivalent pages | Parameterized route name | Exclude query values |
| Phase durations | Separates delay mechanisms | Numeric buckets | No content |
| Long-frame script attribution | Points to responsible bundle and function | Normalized first-party URL and release | Allowlist domains; avoid full URLs |
| Journey state | Explains load-time or large-data conditions | Small approved dimensions | No account or record identifier |
| Release and experiment | Supports regression isolation | Controlled identifiers | Restrict access to experiment context |
Google's field interaction guide shows the attribution build of the web-vitals library providing interaction target, type, input delay, processing duration, presentation delay, and associated Long Animation Frame entries. Send results at page hide using a reliable beacon mechanism. Sample normal visits but retain a higher bounded sample of slow interactions, and impose payload and daily user limits.
Create stable semantic names such as invoice.filter.apply or editor.comment.submit at component boundaries. A selector like the third button inside a generated class is brittle. Record whether the interaction happened during page loading, whether it caused navigation, visible item count bucket, and whether network completion was awaited synchronously. Do not record typed values, labels containing customer data, DOM snapshots, or arbitrary component props.
Triage clusters by impact and mechanism
Rank clusters using affected visits, latency severity, business criticality, regression confidence, and fixability. A checkout confirmation affecting fewer visits may outrank a common cosmetic toggle. Inspect distributions rather than only the worst sample. Determine whether the cluster is broad across devices or concentrated on low-end hardware, a route, a release, large accounts, initial load, or one third-party script.
- Confirm field coverage and rule out an instrumentation or release-mix artifact.
- Name the interaction and reproduce its route, state, dataset bucket, and device conditions.
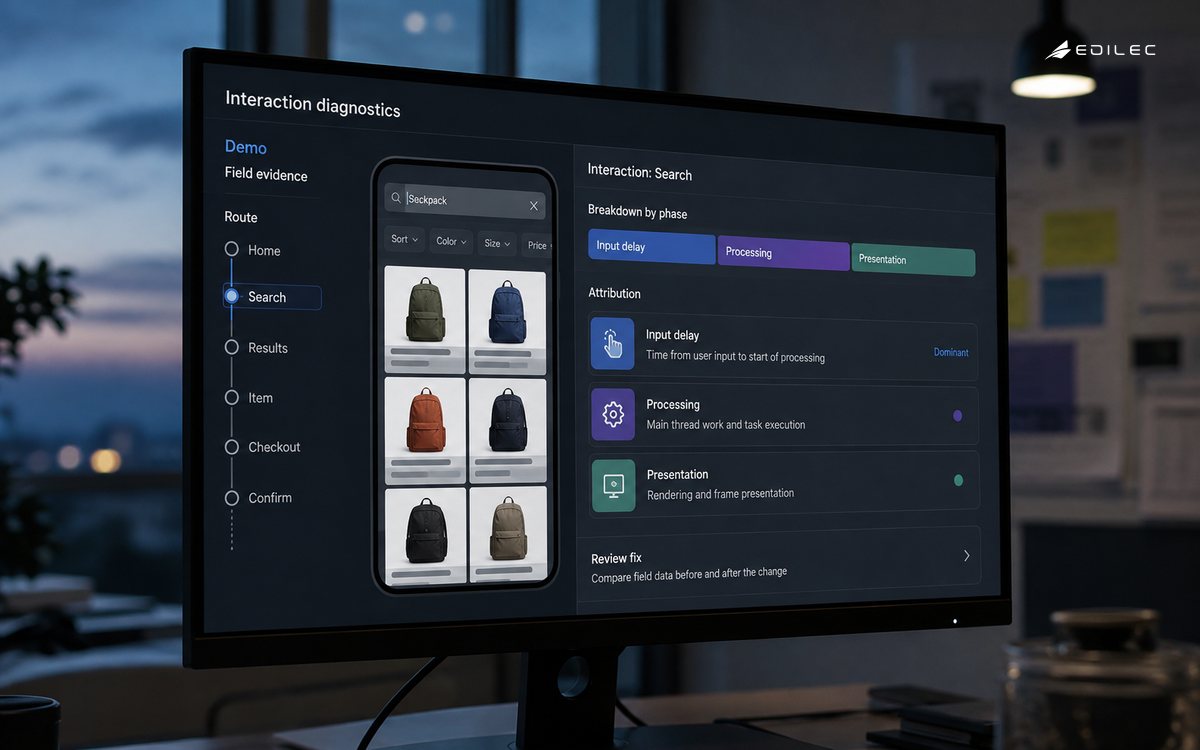
- Compare input, processing, and presentation shares across the slow cluster.
- Use Long Animation Frame and script attribution to form a specific bottleneck hypothesis.
- Reproduce in the lab with representative throttling and production-like data shape.
- Ship a guarded fix and verify the target cluster plus overall field distribution.
Fix the dominant delay phase
For input delay, reduce or split unrelated long tasks, defer nonessential startup and third-party work, yield during large loops, and prioritize the immediate interaction. For processing, perform the minimum synchronous state change needed for feedback, move independent computation after paint or to a worker, reduce framework update scope, and avoid parsing or serializing large payloads in the handler. Do not merely wrap expensive synchronous work in a promise; microtasks can still delay rendering.
For presentation delay, limit DOM size and affected layout, batch reads before writes, avoid forced synchronous layout, simplify expensive selectors and effects, and render only visible or necessary content. The web.dev optimization guide discusses yielding, reducing DOM and rendering work, and avoiding layout thrashing. Give immediate visual feedback before starting network-dependent completion, but ensure the feedback is truthful and accessible.
Use Long Animation Frame attribution carefully
Long Animation Frames expose blocking duration, render timing, and script attribution that can connect a slow interaction to an event listener, promise callback, or animation-frame callback. The field guide notes uneven browser support, so treat LoAF as an enriched subset rather than the denominator for product health. Preserve basic INP attribution for all supported visits and compare enriched samples for selection bias.
Source URLs and function names need source-map and release handling. Map minified positions in a protected diagnostic pipeline, then aggregate to owned module and function. Separate first-party, tag manager, analytics, chat, and other third-party responsibility. A script appearing in the same frame is evidence for investigation, not proof of sole causation; rendering and multiple callbacks can contribute.
Verify the fix in lab and field
Add a deterministic interaction benchmark to prevent obvious regression, but do not declare victory from the lab alone. Canary the release, compare the exact interaction cluster against a concurrent control where possible, and watch errors, task completion, abandonment, and other Web Vitals. A faster first paint that triggers more main-thread work later can improve one path while harming another.
Field confirmation takes enough visits to overcome mix and noise. Compare phase distributions and affected-visit rate, not only origin p75. Verify that instrumentation count and route share remain stable. Keep a rollback threshold for severe regressions. After confirmation, encode a performance budget around the mechanism: maximum synchronous work, list size, bundle ownership, third-party timing, or component render count.
Key takeaways
- Use CrUX for population baseline and first-party RUM for product-level causality.
- Collect semantic interaction, route, release, phase, and bounded Long Animation Frame attribution.
- Protect privacy and metric systems by controlling target and context cardinality.
- Prioritize clusters by user and business impact, then diagnose the dominant delay phase.
- Give immediate truthful feedback while moving nonessential work off the critical frame.
- Verify in the field with stable coverage and convert confirmed causes into budgets and tests.
INP field optimization FAQ
Is CrUX enough to diagnose poor INP?
No. It can show whether eligible pages or an origin have a field problem and provide population trends, but it does not identify your component, action, application state, or responsible code. First-party attribution or another privacy-conscious RUM system is needed for implementation diagnosis.
Should teams track average INP?
An average hides the slow tail and does not match the Core Web Vitals assessment model. Track distributions, p75, poor-visit share, interaction-level percentiles, and sample counts. Averages can supplement diagnostics but should not be the release objective.
Does network latency count in INP?
Network time after the browser paints initial feedback is not directly part of that interaction's latency. Network work can still hurt INP if the handler blocks, parses a large response synchronously, or delays visible feedback until completion. Design the state transition so acknowledgement paints promptly.
Conclusion
INP improves fastest when the team stops treating it as a single page score and starts treating it as evidence about named user actions. Privacy-safe field attribution, phase-based diagnosis, representative reproduction, mechanism-specific fixes, and careful field verification reveal the interaction paths ordinary load tests miss.