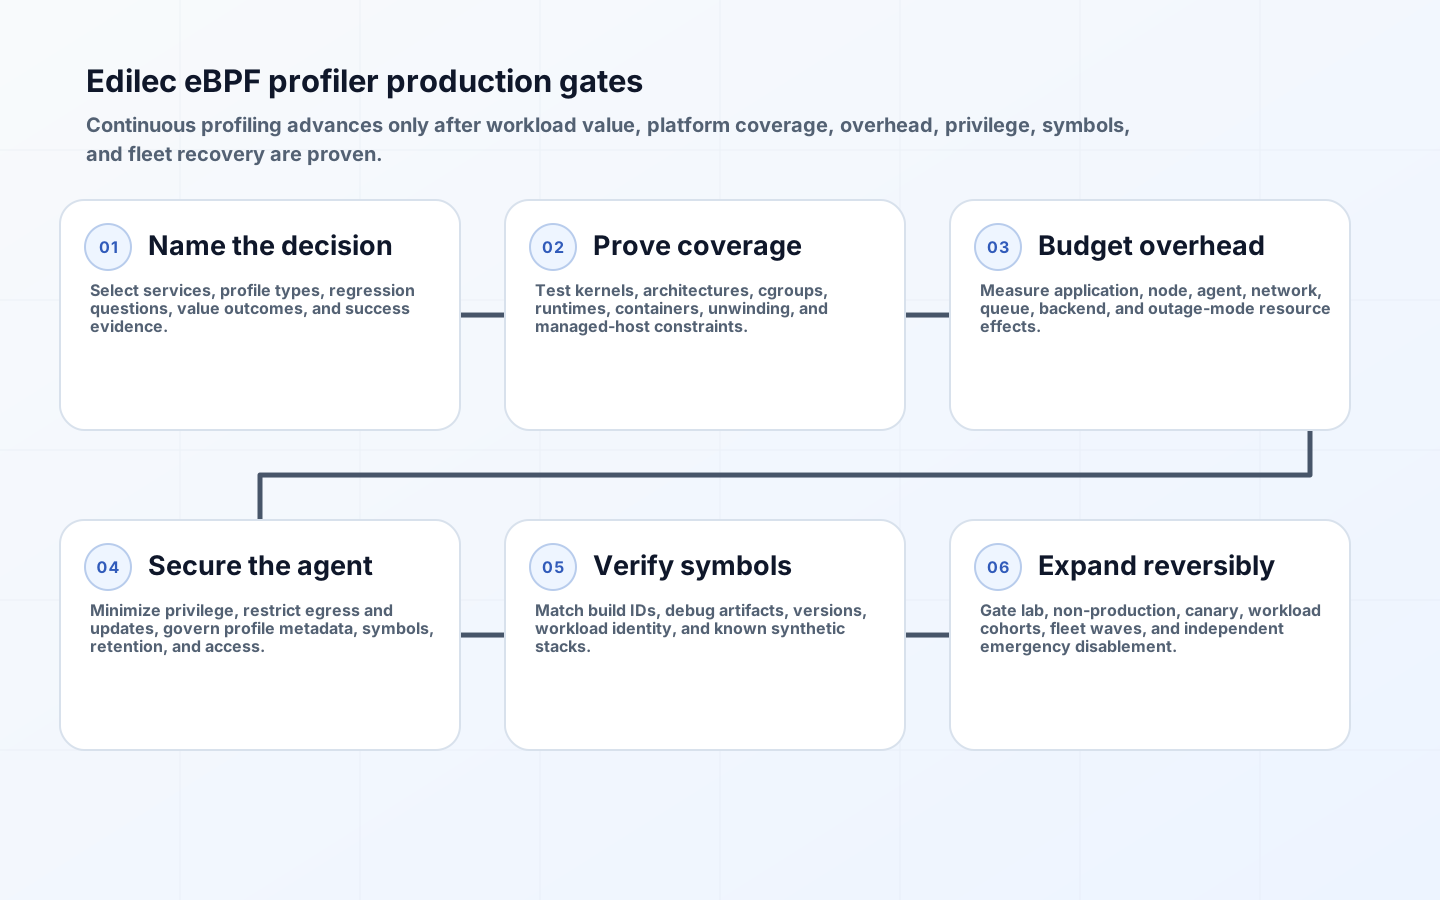
eBPF continuous profiling samples fleet execution over time so engineers can compare where CPU or off-CPU time is spent before, during, and after a regression. It can reduce application-by-application instrumentation, particularly on Linux, but it does not erase runtime differences, missing symbols, kernel compatibility, privilege, storage, or data-governance work. The correct question is not whether a vendor claims low overhead. It is whether a defined workload gets actionable profiles inside a measured production budget.
The eBPF community describes programs as event-driven code attached to kernel or application hook points, verified before execution and often JIT compiled; the eBPF introduction also notes that loading generally requires privilege unless unprivileged use is enabled. A profiler combines those mechanisms with user-space collection, stack unwinding, symbol resolution, aggregation, export, and storage. Each component creates a compatibility and security boundary that deserves explicit ownership.
Define the workload and performance question
Choose initial services with recurring CPU cost, unexplained latency, or expensive capacity rather than enabling the whole fleet for novelty. State decisions the profile should support: identify a hot function after a release, explain CPU per request growth, locate lock or I/O wait, or compare architecture variants. Decide which profile types are required. CPU sampling is broadly useful; wall-clock, off-CPU, allocation, mutex, and language-runtime profiles depend on different mechanisms and tool support.
Build a coverage matrix across kernel versions, distributions, architectures, container runtimes, cgroup modes, languages, compiler settings, stripped binaries, JIT runtimes, and managed-node restrictions. eBPF portability mechanisms improve reach but do not guarantee every stack unwinds or symbolizes correctly. Mark unsupported combinations as visible gaps. A fleet percentage is misleading if the uncovered five percent contains the most critical or expensive workload.
| Surface | Question | Proof | Common limitation |
|---|---|---|---|
| Kernel and host | can programs load and attach safely? | canary load plus verifier and agent logs | managed hosts or old kernels |
| Stack collection | are user and kernel frames complete? | known synthetic stack | frame pointers, JITs, unwinding |
| Symbols | can addresses become stable names? | build-ID matched lookup | stripped or missing artifacts |
| Workload identity | does each sample map to service and version? | catalog and deployment correlation | short-lived processes |
| Backend | can profiles compare over useful windows? | query and retention exercise | aggregation or label mismatch |
| Operations | can rollout stop and recover? | disable and agent-removal drill | host privilege and stale programs |
Measure overhead as a budget, not a promise
Benchmark with the same kernel, node shape, workload, traffic, and symbol path planned for production. Establish a no-profiler baseline, then compare several sampling frequencies and profile types. Measure application throughput and tail latency, node CPU, agent CPU and memory, scheduler effects, network export, local buffering, backend ingest, and storage. Repeat long enough to capture compaction, symbol upload, rotation, and failure recovery. Report confidence intervals or repeated-run spread rather than a single attractive number.
Overhead is workload-dependent. A sampling frequency that is negligible on a large busy node can matter on a small latency-sensitive service. Deep stacks, many processes, difficult unwinding, and symbol churn alter cost. Set separate limits for steady state and failure mode. If the backend is unavailable, the agent must bound queues, spill behavior, retries, and memory. Decide whether profiles may be dropped; host stability should usually outrank perfect profile delivery.
Secure host privilege and profile data
Treat the profiler as privileged host software. Document capabilities, filesystem mounts, process namespace visibility, kernel interfaces, outbound destinations, update mechanism, artifact signature, and who can change configuration. Use the smallest privilege set the exact implementation supports, isolate its service account, restrict egress, and monitor program-load failures. The Linux BPF documentation is the authority for kernel mechanisms; product abstractions do not remove the need to understand what is loaded on a host.
Profiles expose function names, file paths, package names, build IDs, process arguments in some implementations, and architecture details. Symbols can reveal proprietary code structure. Define collection exclusions, redaction, tenant separation, encryption, retention, access logging, legal hold, and deletion. Do not attach raw customer identifiers as profile labels. Restrict symbol upload to approved build outputs and verify that source or debug artifacts do not become broadly downloadable through the profiling interface.
| Risk | Preventive control | Detection | Response |
|---|---|---|---|
| Host resource pressure | sampling and queue limits | agent and node saturation | reduce frequency or disable profile type |
| Kernel incompatibility | tested support matrix and canary | load or attach failures | stop rollout and fall back |
| Broken symbols | build-ID artifact pipeline | unknown-frame percentage | repair symbol source before expansion |
| Sensitive metadata | label allowlist and access policy | policy scan and audit logs | quarantine data and rotate access |
| Backend outage | bounded buffer and retry | drop, queue and export metrics | protect host, accept bounded loss |
| Agent regression | signed staged updates | service and node health comparison | automatic cohort rollback |
Build reliable symbols and workload identity
A flame graph full of unknown addresses is cheap data and expensive disappointment. Preserve build IDs, generate or retain approved debug information, and connect symbol artifacts to immutable software versions. Test native, containerized, interpreted, and JIT-compiled workloads separately. Version the symbol service and cache policy. Confirm that two releases with the same function name remain distinguishable and that deleted workloads retain only the symbols allowed by retention policy.
Map samples to service, environment, cluster, namespace, workload, container, version, node architecture, and profile type using bounded metadata. Avoid volatile pod identifiers as primary query dimensions. The emerging OpenTelemetry Profiles specification was Alpha as of July 2026 and defines profiles as stack traces with values representing resource consumption or execution. Its goals include efficient representation and correlation, but Alpha status means portability claims need exact-version tests.
Roll out by risk cohort and prove value
Begin in a lab, then non-production nodes, a small production canary, one workload cohort, and finally bounded fleet waves. Gate each stage on agent health, host performance, profile completeness, symbol quality, backend availability, and a successful investigation exercise. Keep an emergency disable mechanism independent of the profiling backend. Account for autoscaled and short-lived nodes: bootstrap delay and symbol availability can otherwise bias profiles toward long-running hosts.
Track value through accepted engineering outcomes: regressions localized, capacity avoided, incidents shortened, or performance hypotheses disproved. Review cost per profiled host and useful profile hour, but resist invented savings. The Parca overview provides an official open-source reference architecture; compare any candidate on coverage, data ownership, tenancy, symbolization, query model, operations, and exit path. A pretty flame graph is a demonstration, not an operating model.
Evaluate temporal comparison as carefully as collection. A profile backend should let engineers compare release, environment, cohort, and time window while preserving sample type and units. Normalize for workload when appropriate: more CPU samples during a traffic increase do not by themselves prove worse code. Join deploy markers and request throughput, then inspect both absolute resource use and proportional stack changes. Verify how aggregation handles process restarts, changing labels, missing symbols, and mixed architectures. An attractive differential view can still mislead if its two populations are not comparable.
Define routine care after rollout. Patch agents through the same risk cohorts used for initial deployment; refresh kernel and runtime support matrices; audit privileges, egress, and symbol access; capacity-plan profile storage; and periodically run the synthetic known-stack workload. Review services with high unknown-frame rates or no recent queries and decide whether to repair, narrow, or retire coverage. When a profiler is removed, unload programs, remove host artifacts and credentials, preserve required audit logs, and validate backend deletion. Exit is part of the safety model because privileged agents should not become forgotten infrastructure.
Procurement comparisons should use an evidence pack from the canary. Ask candidates to profile the same binaries and traffic, then compare recognized frames, supported profile types, query latency, retention controls, tenancy, export formats, agent update process, and total ingest plus storage cost. Require documentation for unsupported environments and test what happens when a license or backend expires. This keeps selection focused on fleet fit and operational ownership instead of unverifiable universal-overhead claims. It also creates a repeatable exit benchmark if the platform later moves to another profile backend.
Key takeaways
- Select workloads and decisions before selecting a profiler or enabling the fleet.
- Test kernel, runtime, architecture, unwinding, symbols, and identity as a coverage matrix.
- Measure application and host overhead across steady state and backend failure.
- Treat the agent as privileged software and profiles and symbols as sensitive engineering data.
- Expand by canary gates and retain an independent emergency-disable path.
Frequently asked questions
Is eBPF profiling zero overhead?
No. Sampling, unwinding, aggregation, symbolization, export, and storage consume resources. The relevant question is whether measured overhead stays inside a workload-specific budget.
Does one profiler cover every language equally?
No. Native, interpreted, JIT-compiled, and managed runtimes have different stack and symbol requirements. Verify each supported version with known stacks.
Can profile data be sensitive?
Yes. Function names, paths, build information, labels, and symbols can reveal proprietary architecture or tenant context, so collection and access need controls.
Conclusion
eBPF makes always-on profiling practical for many Linux workloads, not automatic for every fleet. Prove coverage, symbols, overhead, privilege, and data controls on real systems, then expand through reversible cohorts. Continuous profiles earn their place when they repeatedly improve performance decisions without making host stability or code confidentiality the hidden price.