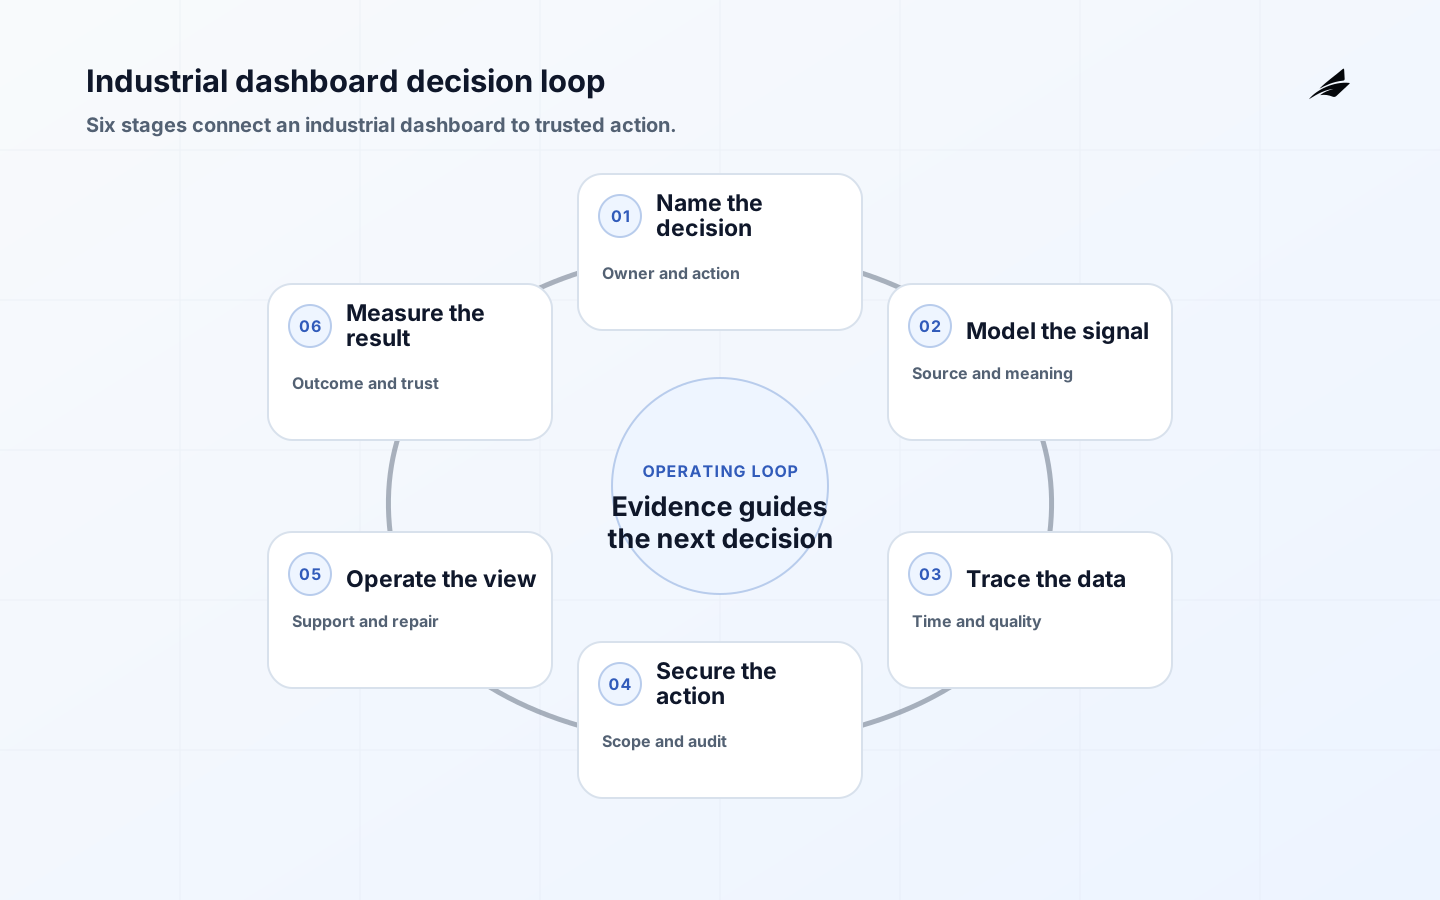
An industrial dashboard earns its place when it helps a person make a better operating decision at the right moment. A wall of gauges is not automatically useful. The founder’s job is to define the decision, the time window, the trusted source, and the action that follows a signal. For a connected factory, that might mean deciding whether a line needs inspection before the next shift; for a distributed asset fleet, it might mean prioritising a service visit. AWS describes IoT as a way to connect devices with cloud services and device software, but the business value appears only after that connection has a governed purpose. This is why AWS IoT SiteWise’s asset model belongs in the architecture conversation, not just the infrastructure checklist.
Name the decision before the dashboard
Start with a sentence that includes an owner, a signal, a threshold, and a permitted response. For example: the maintenance lead reviews compressor temperature and vibration every 30 minutes and can create an inspection task when two readings breach the agreed envelope. This sentence separates a useful view from a decorative one. It also exposes missing decisions: who owns the reading, how fresh it must be, whether the threshold differs by machine, and what happens when the feed is silent. Founders should test the sentence with an operator who does the work. If the operator cannot say what to do next, the dashboard brief is incomplete.
| Design question | Good decision | Evidence to retain |
|---|---|---|
| Who is it for? | One named operating role | Owner and backup owner |
| What changes? | A bounded work action | Task, alert, or review rule |
| How fresh? | A time limit tied to the decision | Observed time and freshness state |
| What if absent? | Stale or unknown state | Exception reason and next check |
Model the signal, not just the screen
A dashboard needs a data contract that survives a redesign. Name the asset, measurement, unit, sampling interval, source, timestamp, quality state, and transformation. Keep raw observation separate from a calculated indicator so a user can tell whether a red tile means a real condition, a late message, or a rule change. MQTT provides flexible publish and subscribe semantics, but it does not decide which message is authoritative for a business metric. An industrial model may also carry equipment hierarchy, location, calibration context, and work-order state. MQTT 5.0 and OPC UA’s information model are useful reference points, while the product team still owns the meaning of each field.
Choose an architecture that can explain itself
For an early release, keep the path visible: device or gateway, transport, ingestion, validation, storage, calculation, interface, and action. A managed service may reduce undifferentiated work, but it does not remove the need to record identity, schema version, and source health. Decide whether the dashboard reads a time-series store, an operational database, or a curated analytical model. Avoid asking one query to serve live control, historical analysis, and executive reporting when their freshness and access needs conflict. The useful test is a trace from a displayed number back to the source message, transformation version, and responsible owner. That trace makes support practical and prevents arguments over which number is real.
Use a small pilot to prove the whole path rather than a large pilot that proves only a beautiful interface. Choose one asset class, one shift or service team, one decision, and a deliberately awkward failure case. Show the operator a missing-data state, a late event, a duplicate reading, and a corrected value. If the experience hides uncertainty, the pilot is teaching the wrong behaviour. Link the dashboard discussion to what changes when MQTT brokers move into production and industrial dashboards for connected systems so architecture and rollout stay connected.
Secure the boundary around action
A read-only dashboard still handles operationally sensitive information, and a dashboard that can acknowledge alarms or create work orders has an action boundary. Separate viewer, analyst, operator, and administrator permissions. Enforce authorization on the server for the asset, action, and current state; do not treat a hidden button as a control. NIST operational technology security guidance is a practical reminder that network reachability and application permission are different questions. Use device identity, short-lived service credentials where possible, protected secrets, audit events, and a clear revocation path. NIST continuous monitoring guidance gives founders a useful way to keep risk and recovery evidence current in the first release.
| Risk | Control in the product | Review signal |
|---|---|---|
| Stale reading looks current | Show age and quality beside value | Stale duration and hidden-stale count |
| Wrong asset is acted on | Carry asset identity through every request | Mismatched asset attempts |
| Broad access exposes operations | Role and asset-scope checks | Denied actions and access review age |
| Alert fatigue hides a real issue | Deduplicate and group alerts | Acknowledgement delay and repeat rate |
Run the founder’s dashboard operating routine
A dashboard is a service with a support burden. Define who watches ingestion health, who owns a metric definition, who handles a device that stops reporting, and who can change a threshold. Give each exception a state such as detected, assigned, contained, waiting, verified, and closed. Keep the person who changed a rule visible. A useful daily review asks which readings are oldest, which assets repeatedly leave the normal envelope, how many alerts were acted on, and whether users exported data because the interface was insufficient. These questions turn a dashboard from a launch artefact into a feedback loop. They also reveal whether the business needs a new screen, a better source, or a clearer policy.
Measure value without rewarding noise
Choose measures that connect reliability to work. Track freshness by source, percentage of signals with known quality, time from alert to acknowledged action, repeat incidents by asset, manual spreadsheet corrections, and decisions completed without escalation. Do not use message volume or dashboard visits as a proxy for operational value. A quiet dashboard can be healthy if the workflow is stable; a busy one can be harmful if it generates unowned work. Review the measures with finance, operations, and engineering together. The founder’s decision is whether the evidence supports expanding scope, changing the model, or stopping a feature that creates attention without improving outcomes.
A practical launch plan
- Write one decision brief with owner, source, freshness, threshold, action, and escalation.
- Trace five real observations from device or gateway to displayed result.
- Test missing, late, duplicate, out-of-range, and corrected data before inviting more users.
- Use least privilege and log every state-changing action.
- Run the dashboard with one operating group for a full review cycle.
- Expand only after the team can explain value, exceptions, and support ownership.
Deployment checks that protect trust
Before expanding an industrial dashboard, run a review with the operator, data owner, security owner, and support owner in the same room. Ask each person to explain the signal, the action, and the failure path in their own words. Reconcile differences before adding another metric. Check the source when a number is disputed, record the decision that follows, and make the correction visible to everyone who relies on the result. This review is especially valuable when a founder is tempted to add a second site or a new executive view before the first workflow has a stable support routine.

The first expansion should be selected from evidence: a repeated exception, an unserved operator role, a source that needs better quality controls, or a decision that still takes a manual export. Keep the dashboard’s semantic definition versioned and publish a short change note when a threshold, unit, calculation, or asset hierarchy changes. A user should not need to compare two screenshots to learn that the meaning changed. The connected systems practical guide provides a useful companion for this staged decision.
- Replay one normal shift and one degraded shift with the displayed data.
- Verify every state-changing action has an actor, target, time, and reason.
- Review stale, corrected, and backfilled data with the metric owner.
- Do not widen scope until support can diagnose the first release without its builder.
Decision review before wider rollout
Before widening the dashboard scope, run a decision review with product, support, security, and an operator who works under the real connectivity constraint. Walk through a normal reading, a late event, a revoked account, a renamed asset, and a queue that cannot converge. Have the operator narrate what appears, what the server accepts, and what support can demonstrate. The goal is not to eliminate every failure; it is to make every important failure bounded and owned.
Keep the next build focused on the largest remaining ambiguity. It may be a better conflict explanation, a safer cancellation path, a smaller cache, or a migration mechanism for old operations. Do not expand offline writes because a cached screen looks successful. Compare the result with what changes when offline sync moves into production and document the evidence that justifies the next capability.
- Replay a write through interruption, duplicate delivery, and a server-side version change.
- Confirm an old client cannot bypass current permission.
- Review local storage and queue retention with a privacy owner.
- Measure time to confirmed outcome before calling the feature reliable.
Key takeaways
- Start with a decision and a named operator, not a collection of metrics.
- Preserve source, time, quality, transformation, and owner context for every important signal.
- Make uncertainty visible and actionable.
- Treat access, alerting, support, and correction as part of the dashboard product.
- Scale only when the first workflow produces trusted evidence.
Frequently asked questions
What should a founder ask before approving an industrial dashboard?
Ask which decision changes, who acts, how fresh the data must be, what proves the result is trustworthy, and who owns the system after launch. If the answer is only that leadership wants visibility, narrow the brief until an operating action is clear.
Should an industrial dashboard show live data?
Only when the decision benefits from live data and the team can display freshness honestly. A stable five-minute view with a clear age indicator is often safer than a nominally live view that silently serves stale values.
What is the smallest useful first release?
One asset class, one decision, one role, one source path, and one recovery routine. Include the failure state and the action record so the pilot tests operations rather than presentation.
Conclusion
Founders should judge industrial dashboards by the quality of decisions they support. Define the operating question, make the data contract explicit, secure the action boundary, and prove recovery from uncertainty. A focused dashboard that operators trust is more valuable than a broad screen that nobody can explain.