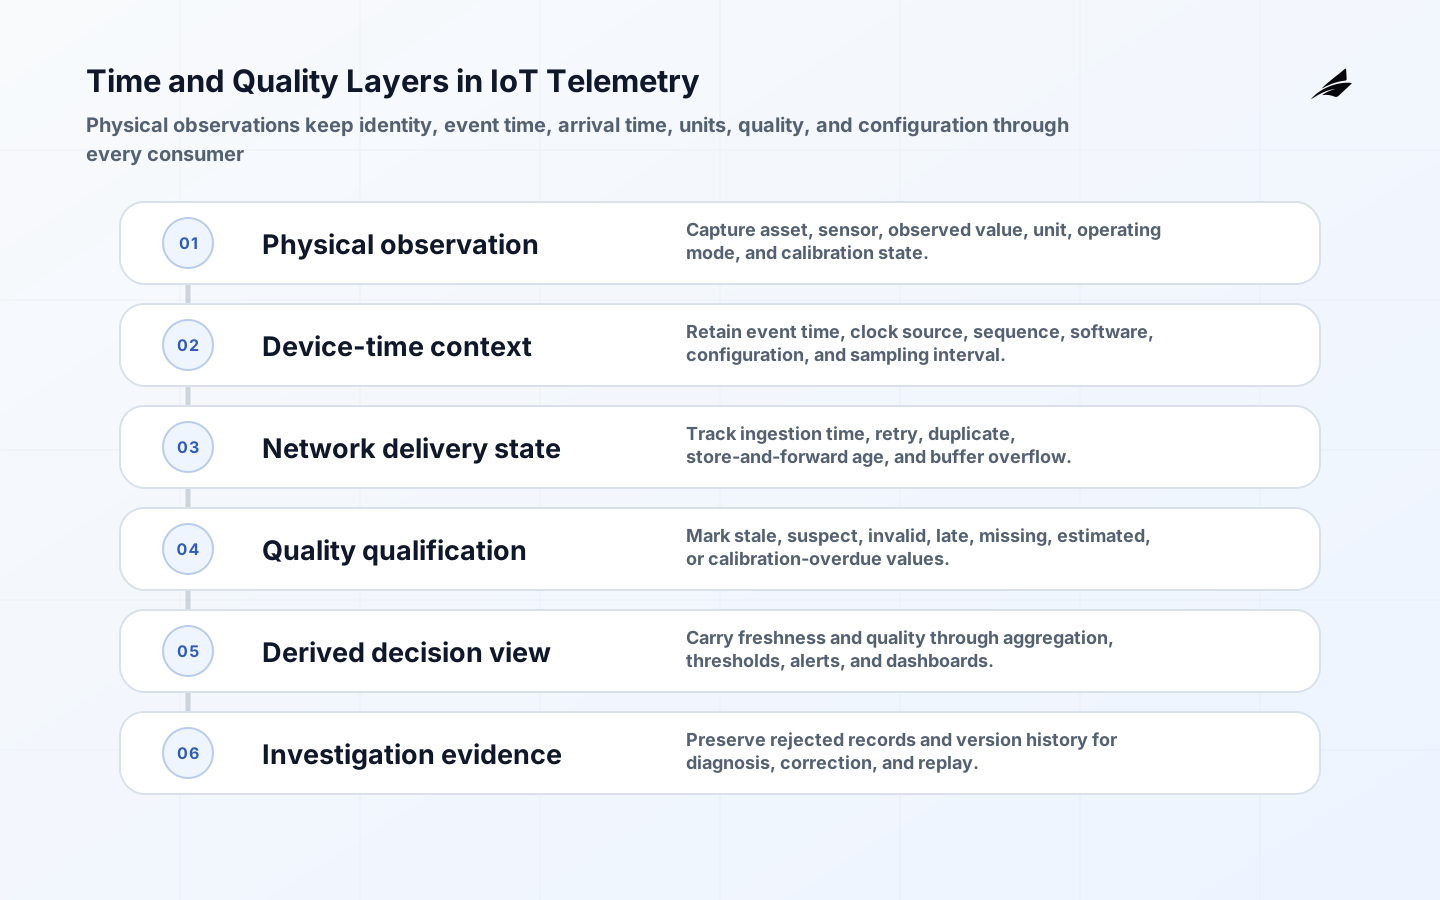
IoT telemetry is data emitted by a connected device or gateway about the physical world, its own state, or the network around it. It becomes useful only when a consumer can answer basic questions: which asset produced this, when did the observation happen, what does the value mean, how trustworthy is it, and what changed after it was received? A temperature, vibration reading, battery percentage, or connectivity event without that context is a loose number. Product teams should design IoT telemetry as evidence for a decision, not as an indiscriminate collection exercise.
Define Telemetry as an Evidence Contract
Start with the decision and work backward. A maintenance coordinator deciding whether to investigate a pump may need observed vibration, operating mode, threshold rule, sensor location, sampling interval, and last communication time. A billing process may need a signed or reconciled meter interval rather than every raw sample. Put the stable asset ID, measurement name, value, unit, observed time, source time, quality state, and schema version in a documented contract. When a gateway enriches the record, preserve which fields came from the device and which were added later.
| Field | Purpose | Common mistake |
|---|---|---|
| Observed timestamp | Places the physical observation in time | Using only arrival time after an offline period |
| Asset and sensor IDs | Connects value to installation history | Using a mutable display name as an identifier |
| Unit and measurement definition | Makes numbers comparable | Mixing Celsius, Fahrenheit, and unknown scaling |
| Quality state | Explains suspect, missing, or estimated values | Discarding bad data without a trace |
Plan for Real Network Behavior
Field networks disconnect, clocks drift, devices restart, and messages arrive more than once. That does not make telemetry unusable; it defines the system you must build. Retain both event time and ingestion time, synchronize clocks where possible, and flag records that arrive outside the normal delay window. Decide whether a device sequence number, gateway receipt sequence, or event identifier can detect gaps and duplicates. A consumer should be able to distinguish no observation from an observed value of zero. It should also know when a device is silent because the asset is intentionally powered down.
- Define expected reporting cadence by device class and operating mode.
- Transmit a compact heartbeat that carries software version, configuration version, and last successful measurement time.
- Use store-and-forward buffering with a limit and a visible overflow signal.
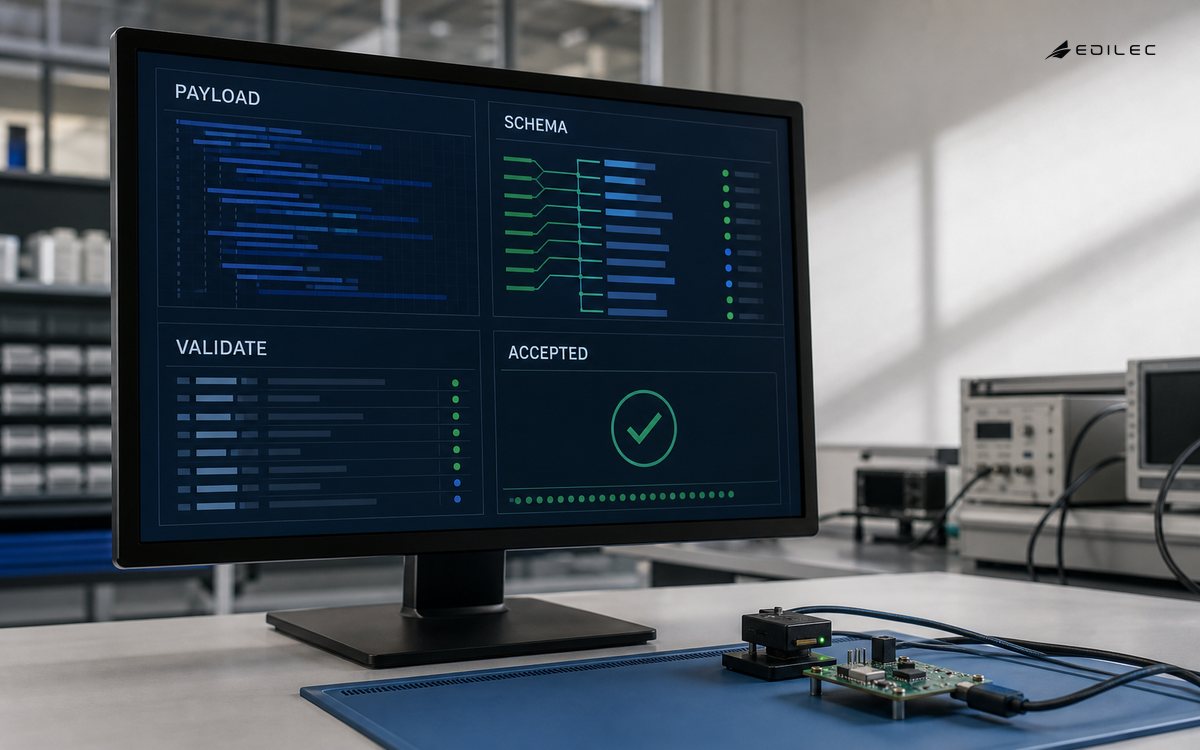
- Validate payload range, unit, and timestamp before a record reaches a downstream dashboard.
- Preserve rejected telemetry with a controlled retention period for diagnosis and replay.
Make Quality Visible Through the Pipeline
Quality is not a cleanup job performed once at ingestion. A record may be valid syntactically yet stale, uncalibrated, outside physical range, or inconsistent with the asset's operating state. Carry those conditions as fields or linked records through aggregations and alerts. A daily average should say how much data was expected, received, excluded, and estimated. When quality changes, avoid silently replacing historical results. Publish a new derived dataset or versioned calculation so users can see why an earlier chart and a later report differ.
| Condition | Treatment | User-facing signal |
|---|---|---|
| Late arrival | Store with event time; recompute affected windows under policy | Late-data marker and refresh time |
| Out-of-range value | Quarantine or retain as suspect depending on domain | Validation reason and review status |
| Missing interval | Represent absence explicitly, not as zero | Completeness percentage or gap |
| Calibration overdue | Keep value but qualify its decision use | Calibration state and evidence link |
Control Volume, Cost, and Access
Sampling every possible attribute at the highest rate is rarely an architecture. Estimate message size, reporting cadence, retained history, transformation cost, and who actually uses each signal. Use edge aggregation or exception reporting when it retains the needed decision evidence without shipping needless volume. Apply authorization to device identity, topic or API scope, and the data plane that serves users. A tenant or technician should see only records they are entitled to inspect. MQTT brokers provide one transport pattern; event streaming explains durable downstream consumption.
Verify With an Investigation
Before broad rollout, ask an engineer to investigate one alert using only the new telemetry path. Include an offline interval, a late message, a replaced sensor, and a configuration change. Can they identify the asset, determine the observation's age, compare it with the right baseline, and find why the alert fired? Track time to answer, incomplete records, and manual exports required. This exercise exposes gaps that throughput tests miss, particularly around identity, time, quality, and cross-system context.
IoT Telemetry FAQ
What is the right sampling rate?
The rate must support the decision and the physics of the process. Start from the fastest change that matters, the acceptable detection delay, device power budget, network cost, and retention plan. Higher frequency is not automatically more useful if the downstream workflow cannot act on it.
Should invalid telemetry be deleted?
Usually no. Mark, quarantine, and restrict it according to policy so engineers can diagnose the producer or replay a corrected parser. Do not let suspect records silently contaminate operational calculations or become broadly visible without their quality context.
Key Takeaways
- Treat every signal as evidence with identity, time, unit, and quality context.
- Design for late, missing, duplicate, and offline records before the first dashboard.
- Carry quality through aggregation and alerting rather than hiding it at ingestion.
- Validate the system with a real operational investigation.
Conclusion
IoT telemetry becomes dependable when teams can trace an operational claim back to a physical observation and understand its limits. Define the contract, preserve timing and quality, and test whether people can investigate the resulting records. That foundation makes later analytics and automation far more credible.
Run an Operational Review
Implementation Notes
Implement IoT telemetry as a sequence of observable releases. In the first release, keep the producer or source, identity registry, validation rule, one consumer, and support view connected end to end. Capture a baseline before switching users over: current completion time, recurring error, number of manual reconciliations, and the records that are difficult to explain. During a limited rollout, compare the new path with that baseline and look for unexpected gaps between the digital record and the physical or operational reality. A release that makes uncertainty visible is safer than one that reports success because traffic is flowing.
Configuration deserves the same discipline as application code. Version thresholds, mappings, topic or route permissions, asset associations, and retention rules; review changes with the owner of the affected workflow; and record when the new configuration became effective. This protects IoT telemetry from a common production failure: correct software interpreting a changed environment with an old assumption. Build a rollback that restores the previous known-good behavior, then test it with evidence that downstream consumers, users, and support tools see a coherent state.
Capacity planning is also a correctness concern. Estimate peak rather than average input, reconnect storms after a site outage, retained history, processing windows, and the time needed to catch up without making live work stale. Set quotas and backpressure behavior deliberately. If the system must shed load, define the least harmful data to defer and how an operator will know that it happened. Review cost alongside quality because an uncontrolled IoT telemetry design may become so expensive that teams disable retention or diagnostics precisely when they are needed for an incident.
Finally, give users an honest interface to system state. Show whether the latest information is fresh, whether an action is pending or confirmed, and who owns the next exception. Do not represent a queued request as a completed business result. Provide a stable case or correlation identifier that lets a technician, analyst, and support engineer discuss the same occurrence without copying opaque payloads into chat. These details turn IoT telemetry from infrastructure that only specialists can interpret into a dependable part of daily operations.
IoT telemetry deserves a scheduled operating review because production evidence changes the design assumptions made during delivery. Review a representative week of normal activity and one difficult incident with the people who own the asset, service, security, and data responsibilities. Trace a record from its first observation to its final use. Check identity, timestamps, configuration or schema version, access decision, retry history, and the person who handled the exception. This is where a team discovers that a technically successful message had no business owner, an alert reached the wrong queue, or a recovered device quietly produced an older configuration. Record each finding as a concrete change with an accountable owner and due date. For IoT Telemetry for Connected Systems: A Practical Guide, that review is more valuable than a generic maturity score because it tests the actual route users depend upon.
Use a small scorecard that measures reliability and usefulness together. Count incomplete records, stale evidence, unassigned exceptions, manual workarounds, recovery time, and decisions later reversed because context was missing. Segment those measures by site, device class, software version, and workflow state so a broad average does not hide a troubled cohort. Then test a repair: replay an event or record, rotate an identity, restore a blocked integration, and confirm the person doing the work can explain the result. The aim is not perfect data or zero alerts. It is a IoT telemetry service whose limitations are visible, whose failures have a practiced route, and whose next improvement is selected from evidence rather than anecdote.