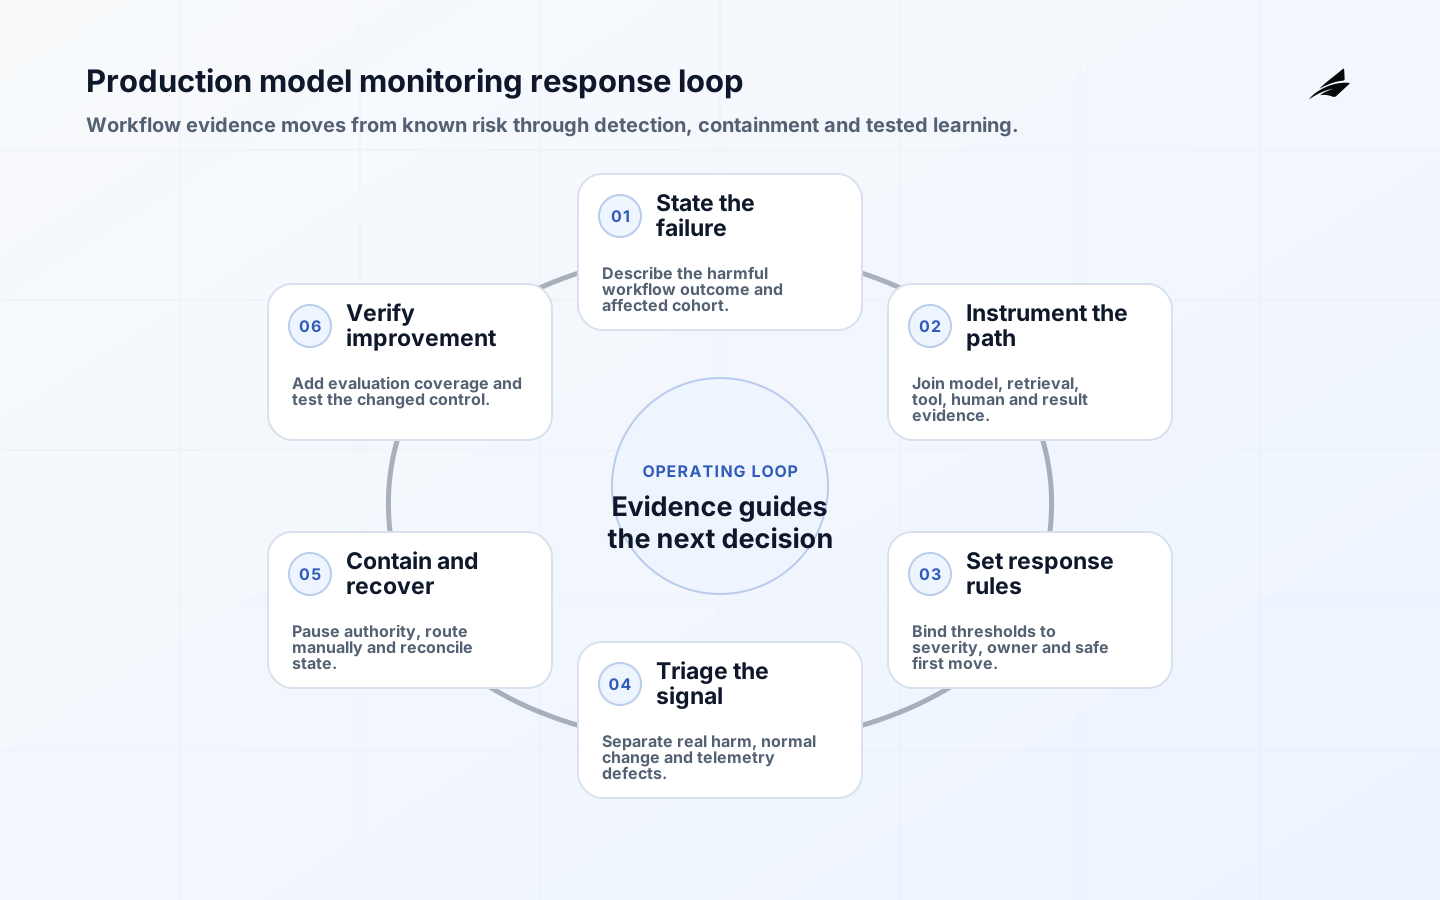
Model monitoring for production workflows asks whether an AI-enabled service is still producing acceptable outcomes for the people who depend on it. Availability and latency matter, but they cannot reveal a quiet rise in reviewer corrections, unequal failure across case types, a stale retrieval source, or a tool that writes the wrong business state. Effective monitoring joins model, data, prompt, retrieval, policy, tool, human, and outcome evidence around one traceable workflow. It gives an owner enough information to distinguish normal variation from a material incident and enough authority to contain the problem.
Build the monitoring plan with Edilec’s model evaluation guide, LLM observability checklist, and AI escalation-rules guide. Evaluation sets explain expected behavior, telemetry explains production behavior, and escalation rules connect evidence to a human decision.
Map the production decision
Document the input sources, transformations, model and prompt versions, retrieved context, tools, policy checks, reviewer steps and downstream systems. For each boundary, decide what metadata can be retained without collecting unnecessary sensitive content. A correlation identifier should connect a customer case to its technical trace while access to prompt and output content remains restricted. Define normal, degraded and prohibited outcomes in business language. For a service triage model, normal may mean a correctly routed case with a clear explanation; degraded may mean a slower manual queue; prohibited may mean a high-severity case closed without qualified review. This map gives alerts a purpose and tells on-call staff which action is safe when a component fails.
| Signal | What it reveals | Owner response |
|---|---|---|
| Input distribution | New language, source or case mix | Assess coverage and add samples |
| Abstention rate | Policy or confidence control activation | Check queue capacity and cause |
| Reviewer override | Potential quality or policy mismatch | Sample, categorize and correct |
| Outcome quality | Whether users receive the intended result | Compare to service baseline |
| Tool failure | Unsafe or incomplete downstream action | Contain, retry or route manually |
Measure model and workflow health separately
Separate technical performance from operational performance. Technical measures can include response time, error rate, provider failures, retrieval coverage, tool-call success and changes in input characteristics. Operational measures should cover correct completion, escalation rate, review effort, reopened cases, customer complaints and the time to recover a bad decision. Segment these measures by case type and risk tier. A model may improve average drafting quality while performing poorly for a small but material customer group. Build evaluation data from genuine service cases with careful permissions and de-identification, then version the labels and scoring guidance. When labels are subjective, measure reviewer agreement rather than presenting a fragile score as objective truth.
Drift is not limited to model weights. It can arrive through a changed form, a vendor update, new terminology, altered retrieval content, a different tool response or a policy revision. Track changes as events alongside metrics. Before changing a model, prompt, retrieval configuration or decision threshold, run regression tests that include expected, ambiguous and adversarial cases. In production, compare the new route in shadow or limited exposure where possible. A sudden metric movement needs a runbook that helps staff distinguish a real incident from seasonal demand or an instrumentation defect. The appropriate initial action may be to increase review, disable a tool, limit a cohort or route all cases to manual handling.
| Condition | Detection | Safe first move |
|---|---|---|
| Quality regression | Sample failures or rising overrides | Increase review and halt expansion |
| Prompt injection attempt | Policy or content classifier signal | Block tool access and preserve evidence |
| Retrieval outage | Coverage and dependency alert | Use approved fallback or abstain |
| Tool action mismatch | Expected versus actual state check | Stop retries and reconcile |
| Privacy concern | Access or content anomaly | Restrict access and notify incident owner |
Set alerts around actionable thresholds
Alert only when a person has a defined response. Tie each threshold to a risk tier, accountable owner, service-hours expectation and a first diagnostic step. Combine rate-based alerts with case sampling; an average can remain stable while a specific high-impact scenario fails. For example, a small count of incorrect priority decisions may justify immediate review even when overall completion is high. Keep alert payloads focused on identifiers, versions and affected dimensions rather than full customer content. Test alerts during a planned exercise so the team can find the trace, apply a kill switch, manage work in flight and communicate clearly. An alert that has never been exercised is an assumption, not a control.
- Assign a decision owner, technical owner and incident commander for material workflows.
- Version models, prompts, retrieval indexes, tools and evaluation sets.
- Retain enough metadata to reconstruct an outcome without exposing unnecessary content.
- Sample outcomes by risk tier, not only at random.
- Exercise manual fallback and reconciliation before a high-severity incident.
Learn from model incidents
Use a blameless review when monitoring finds harm, a near miss or a control that worked only by luck. Reconstruct the timeline: what changed, what the system saw, which policy applied, how the outcome reached a user, what detection worked and which people had authority to contain it. Focus action items on concrete changes such as an evaluation case, a tool permission, an alert threshold, a reviewer instruction or a missing dependency check. Do not close the review merely because a prompt was adjusted. Verify the fix with the relevant case class and carry it through the next release review. Over time, incident themes should influence product scope: a workflow may need a narrower authority boundary rather than a more elaborate set of model instructions.
Operate a regular review loop
Daily monitoring protects active users, but governance requires a slower rhythm too. Review service measures weekly, evaluate representative cases after meaningful changes, and revisit risk assumptions quarterly or when the business process changes. Include operations, domain specialists, engineering and security in the review of material workflows. Their combined perspective prevents the organization from treating a technically healthy system as a successful service when operators are creating workarounds. Record the decision, evidence, owner and review date. Monitoring is complete only when it influences an action: retain the current boundary, improve controls, expand under new conditions or decommission the capability.
Build the monitoring plan from the risk profile
The NIST AI Risk Management Framework treats measurement as one part of a broader cycle that also governs, maps, and manages risk. That matters operationally: a metric without context or response authority is not a control. The NIST Generative AI Profile highlights risks such as confabulation, privacy, information integrity, security, and third-party dependencies. Translate the applicable risks into observable failure statements. “Unsupported policy answer reaches a customer” is more useful than “hallucination rises,” because it names the affected outcome and response boundary.
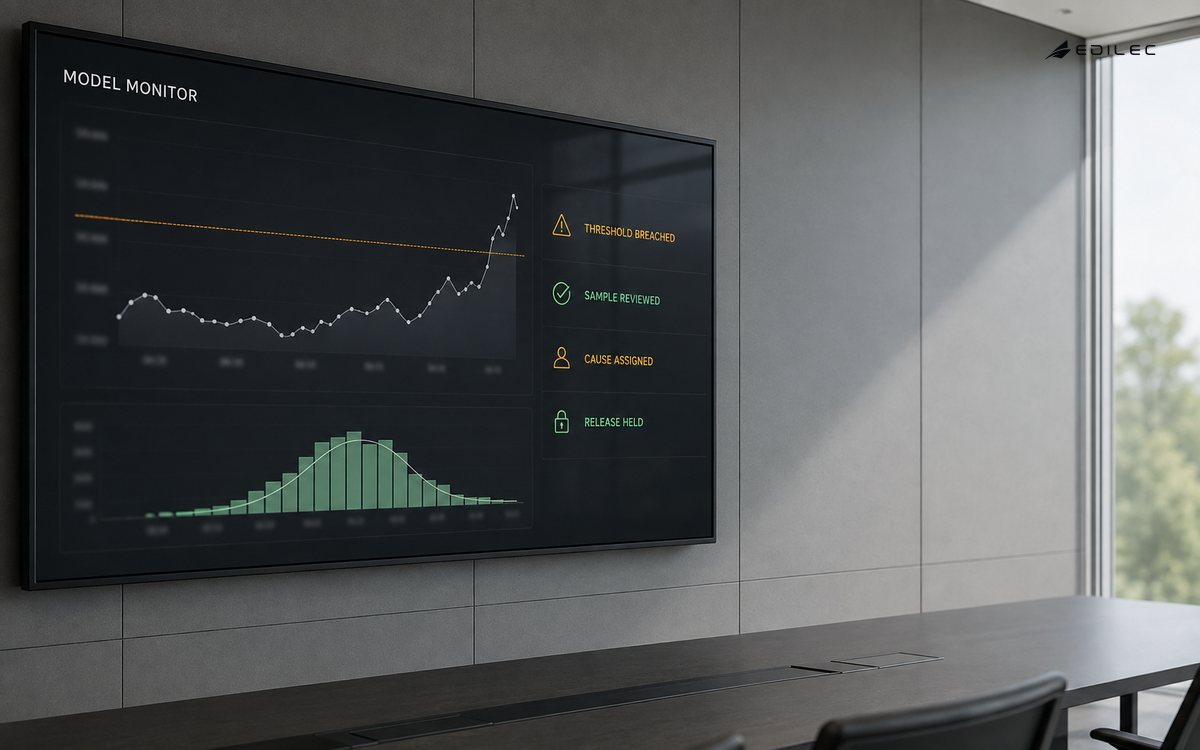
| Monitoring layer | Example signal | Decision it supports |
|---|---|---|
| Service | Latency, dependency error, queue depth | Fail over, degrade, or stop intake |
| Model and retrieval | Evaluation score, citation support, source freshness | Hold release or refresh evidence |
| Policy and tool | Denied request, tool mismatch, state conflict | Restrict authority or reconcile action |
| Human workflow | Override, escalation, review time, disagreement | Improve guidance or staffing |
| Business outcome | Reopen, complaint, completion, disparity | Change product boundary or retire service |
Define a telemetry contract that respects people
Use traces to join a workflow, metrics to reveal population-level change, and logs or sampled records to explain individual failures. The OpenTelemetry observability primer distinguishes these signals and their roles. Record version identifiers, policy outcomes, tool names, safe dimensions, and correlation IDs by default; retain full prompts or outputs only when there is a justified purpose, access control, and retention period. Test the collector and alert path itself, because missing telemetry can otherwise resemble healthy production.
Turn a model incident into tested change
During review, reconstruct what changed, which cohort was affected, what the service believed, where a human could intervene, and why detection succeeded or failed. Google’s SRE guidance on postmortem culture emphasizes learning rather than blame. Corrective work should produce an observable artifact: a new evaluation case, a narrower tool scope, a validated source, a revised threshold, a stronger fallback, or a clearer runbook. Verify the change against the original incident class before restoring exposure.
Key takeaways
- Monitor the customer or operator outcome, not just inference health.
- Keep technical, operational and risk signals distinct but correlated.
- Treat prompts, retrieval and tool contracts as versioned production dependencies.
- Make every alert actionable with an owner and tested response.
- Use incidents to improve authority boundaries and evaluation coverage.
- Review evidence on a cadence that can change product and operating decisions.
Frequently asked questions
Which metric should be monitored first?
Start with the business outcome that the workflow is meant to improve, paired with the most serious failure that must not occur. Then add technical signals needed to explain movement in those measures. A quick response time alone is rarely a useful first indicator.
Should prompts and outputs be logged?
Log the minimum needed for support, evaluation and security, then protect it with access controls and retention rules. Often identifiers, versions, policy results and sampled, permissioned content are more appropriate than unrestricted full transcripts.
Keep the monitoring system reliable
Monitor the monitoring path itself. A silent collector failure, broken correlation field, discarded sample or dashboard-permission change can create false reassurance during the exact event the service needs evidence. Define health checks for instrumentation, ingestion delay, schema validation, alert delivery and access to incident views. When possible, compare independent signals, such as a synthetic request and an externally observed completion event. Test what an operator sees when telemetry is partial and write a conservative response rule for that situation. A service team should be able to say whether an apparent recovery is measured or merely inferred. Treat changes to monitoring configuration with the same review discipline as changes to the workflow it describes.
Define evidence retention and access
Monitoring records can become valuable for support, audits and model evaluation, but retaining every request forever is rarely necessary or appropriate. Classify telemetry by purpose, sensitivity and retention period. Keep immutable release and policy metadata longer than sampled content when reconstruction requires it. Limit access to detailed examples, log administrative retrieval and document how a customer or internal data request is handled. During an incident, responders should know which evidence is available, who may access it and how to preserve it without expanding exposure. This discipline lets a service learn from production while respecting the people whose work generated the signal.
Conclusion
Production model monitoring is successful when it shortens the path from emerging harm to a proportionate response. Observe the whole workflow, segment outcomes by meaningful risk, protect the evidence, and rehearse containment. A dashboard is only the surface; the capability is the team’s ability to notice, decide, recover, and learn.