LLM observability for AI automation is the ability to explain whether an AI-enabled service completed its intended task, which model, prompt, retrieval and tool path produced the result, what it cost, which controls applied, and how the team can investigate failure without exposing unnecessary sensitive content. Provider latency and token dashboards are useful, but they do not reveal whether a customer received an unsupported answer or whether an agent acted on the wrong record.
Treat the LLM as one component in a distributed workflow. A request may pass through authentication, retrieval, several model calls, tools, queues, human approval and an external system. Correlate those stages around a business operation. Edilec's guides to agent memory, AI workflow approvals and production MCP servers cover components whose state and authority should appear in that trace.
Define the observable user outcome
Start with the service promise. A knowledge assistant should return a supported answer or a useful no-answer state. A document workflow should extract required fields, route uncertainty and preserve evidence. An agent should complete an allowed action once or hand it to a person with context. Define success, harmful failure, acceptable degradation and time objective for each task class. Model-level metrics become meaningful only when connected to these outcomes.
Choose service-level indicators that users and operators can interpret: supported resolution rate, correct routing, unauthorized-action prevention, human correction, no-answer precision, end-to-end latency and cost per successful task. Segment by workflow, user group, language, model version and risk level. A global average can hide a failure concentrated in one product or document type. The Google SRE chapter on monitoring distributed systems emphasizes symptoms, actionable signals and the limits of averages; those lessons apply directly to AI services.
| Signal family | Example | Question answered |
|---|---|---|
| Outcome | Supported task completion | Did the user receive useful, safe work? |
| Quality | Groundedness or extraction accuracy | Was the result correct enough for this task? |
| Control | Denied unauthorized tool request | Did policy prevent unsafe authority? |
| Reliability | End-to-end latency and fallback rate | Could the service complete on time? |
| Cost | Cost per successful case | Is resource use proportionate to value? |
| Experience | Correction, escalation and abandonment | Where did people lose trust or take over? |
Trace the complete workflow
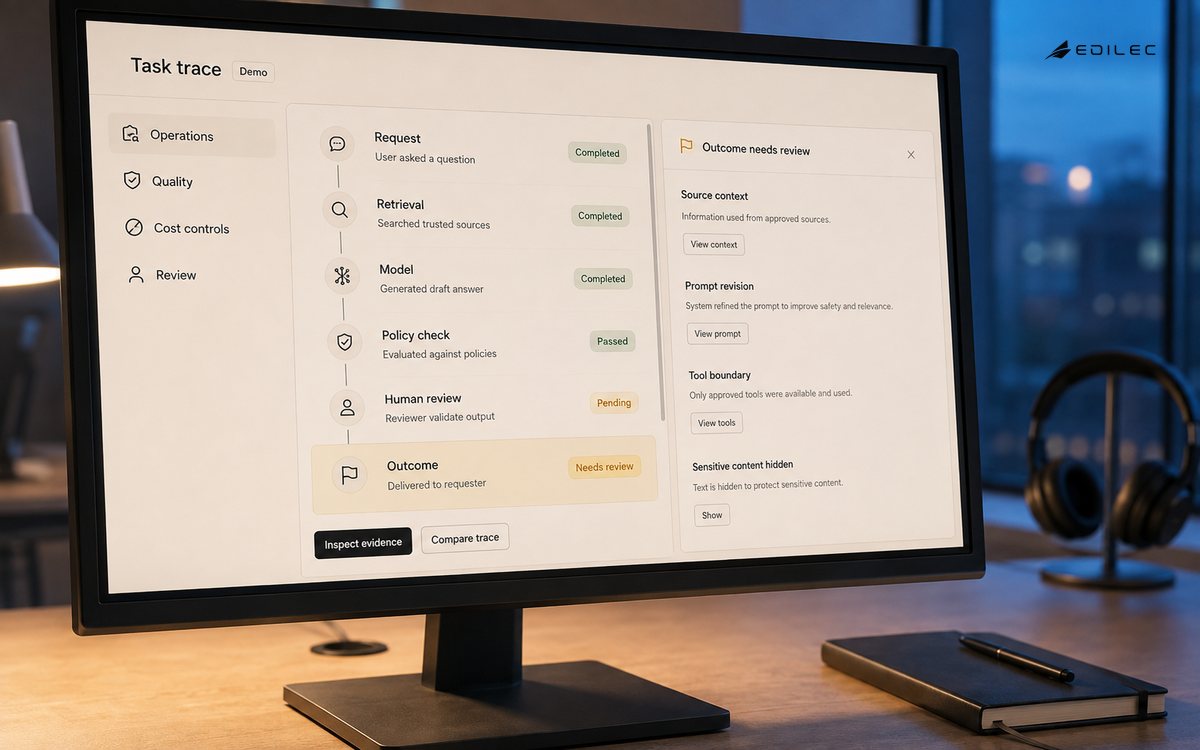
Create a trace for one business request and spans for retrieval, model inference, tool selection, policy checks, tool execution, queue work and human approval. Carry correlation identifiers across asynchronous boundaries and external calls where possible. Record operation name, start and end, status, retry, model and prompt version, retrieval index version, tool, policy decision and outcome identifier. Avoid high-cardinality attributes in metrics, and use traces or protected logs for request-specific detail.
OpenTelemetry's generative AI semantic conventions provide shared attributes and event models for GenAI operations. Adopt stable conventions where they match the system, then add business attributes deliberately. Semantic conventions evolve, so pin the version used by instrumentation and collectors. Do not wait for every field to stabilize before correlating the workflow. A minimal trace with reliable identifiers and component versions is more useful than a large payload that cannot be queried safely.
Record version and decision context
An output cannot be reproduced or compared without component identity. Record application release, provider, model name and version where available, system prompt version, template, retrieval configuration, embedding and reranker versions, tool schema, policy version and feature flags. For dynamic prompts, store a protected hash or template identifier and the structured inputs needed for investigation. Preserve rollout cohort and fallback path. If providers alias model names, record response metadata and deployment date.
Capture decisions, not only requests. For retrieval, record candidate and selected source identifiers, scores or ranks where useful, mandatory filters and index freshness. For tools, record proposed action, validated parameters, authorization result, approval and final effect. For human review, record whether the person accepted, edited, rejected or escalated and which evidence was visible. These events make it possible to distinguish model error, stale knowledge, policy denial, tool failure and reviewer correction.
- Use one correlation identifier for the business operation across model and non-model spans.
- Record component and policy versions on every material decision.
- Store source identifiers rather than entire sensitive documents in ordinary traces.
- Separate proposed, approved, attempted and completed tool actions.
- Include fallback and human-intervention events in the same trace.
- Retain enough context to reproduce an evaluation without copying unnecessary private content.
Protect prompts, outputs and observability data
Prompts, retrieved context, outputs and tool parameters may contain personal data, secrets, confidential business records and hostile content. Default to metadata and identifiers. Collect full content only for a defined support or evaluation purpose, with sampling, redaction, access control, retention and deletion. Apply redaction before export to third-party telemetry when possible. Restrict search and export of traces, audit access, and prevent routine dashboards from revealing user conversations.
Redaction can remove the evidence needed to diagnose a failure, so design layered access. Ordinary operations may see task type, versions, latency, decision codes and source identifiers. A small authorized group can retrieve protected content for a case under a recorded purpose. Keep security events and audit evidence resistant to alteration by the application under investigation. The OWASP LLM application risks include sensitive information disclosure and unbounded consumption; observability must detect these problems without becoming a second disclosure path.
| Data item | Default telemetry | Protected investigation detail |
|---|---|---|
| User prompt | Length, task class and redaction flags | Full text only under approved purpose |
| Retrieved content | Source IDs, ranks and permission result | Exact versioned passages |
| Model output | Schema result, safety flags and hash | Full output for selected case |
| Tool call | Tool, policy result and outcome | Reviewed parameters with sensitive fields protected |
| Human review | Decision type and duration | Reviewer note and displayed evidence |
| Cost | Tokens, requests and normalized cost | Provider billing record |
Join online signals with offline evaluation
Online telemetry reveals real distributions and incidents but often lacks immediate ground truth. Offline evaluation provides repeatable judgments but can drift from production. Sample traces by task, failure and user segment, remove or protect sensitive content, and add expert labels. Turn confirmed incidents and high-value corrections into regression cases. Keep the evaluation dataset versioned and separate test from tuning. Compare candidate changes against the same baseline before rollout.
Use automated evaluators cautiously. Deterministic checks are strong for schema, citations, forbidden actions and known answers. Model-based judges can scale nuanced review but have their own bias, variance and versioning. Calibrate them against human labels and record judge model, prompt and threshold. The NIST AI RMF Playbook encourages measurement in context and continuing management; no single score substitutes for outcome, control and stakeholder evidence.
Set objectives, budgets and actionable alerts
Set objectives by task class: supported-answer rate, p95 end-to-end latency, tool completion, review queue age, unauthorized-action rate and cost per successful outcome. Define error budgets for reliability and quality where the measure is stable enough. Alert on conditions requiring prompt action: a sudden rise in failed tool authorization, missing retrieval source, fallback spike, queue backlog, provider errors or cost runaway. Trend slower quality and drift signals through review rather than paging people for every statistical movement.
Cost observability should attribute input, output, embedding, reranking, tool and infrastructure use to workflow and outcome. Token totals alone can reward shorter but unsuccessful responses. Monitor retries, loops, oversized context, cache behavior and model routing. Apply per-request and per-tenant budgets, maximum iterations and timeouts. When a budget is reached, stop safely or route to a lower-cost or human path. Make resource limits visible in traces so operators can distinguish a deliberate stop from provider failure.
Diagnose and respond to AI incidents
Prepare queries and runbooks for common failure classes: unsupported output, permission leak, prompt injection, stale index, tool misuse, provider degradation, model regression, runaway loop and evaluation pipeline failure. Responders should identify affected versions, users, sources and actions; disable a model, prompt, connector or tool; revoke queued actions; switch fallback; preserve evidence; and assess whether generated content or external actions must be corrected. A general application rollback may not remove cached context or already queued work.
After an incident, add the case to the evaluation set, improve trace context and review whether an alert could have detected the earliest actionable signal. Measure time to identify the failing component and time to contain consequential effects. Avoid using raw user complaint counts as the only quality metric; complaints are valuable but unevenly reported. Combine them with corrections, escalations, trace samples and domain review. Feed learning into product, policy, retrieval and model changes.
Operate an LLM observability signal loop
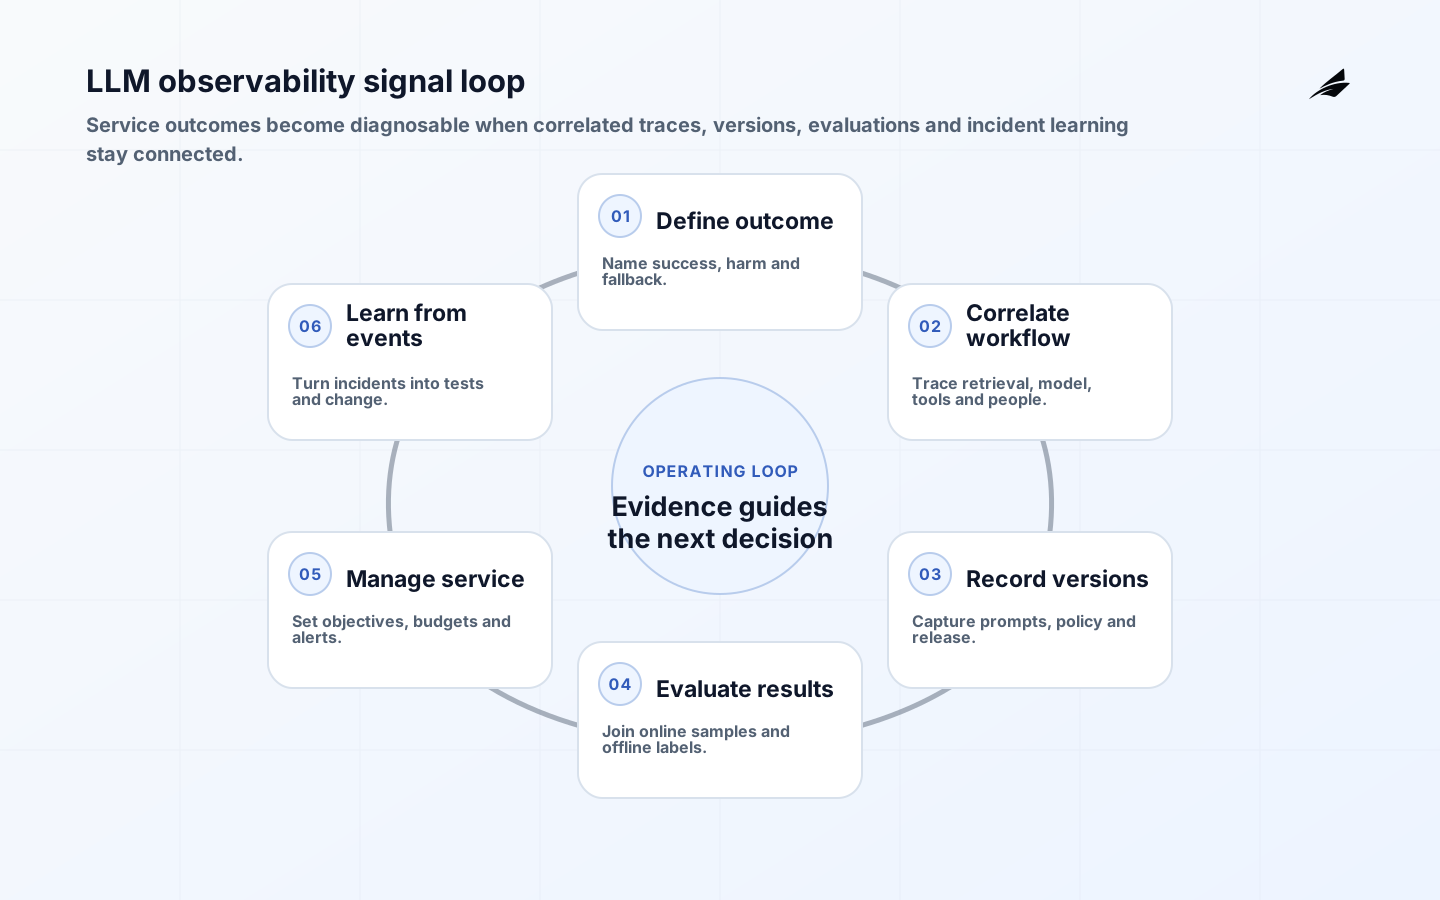
The diagram connects six activities: define the user outcome, correlate the workflow, record versions and decisions, evaluate representative results, manage objectives and budgets, and learn from incidents and corrections. The loop closes because observations must change tests, controls and releases. A trace archive with no review process is storage, not observability; a quality score with no path to a component version is not diagnosable.
Key takeaways
- Define task success and harmful failure before selecting telemetry.
- Trace the complete workflow across retrieval, models, tools, approvals and external effects.
- Record every material component and policy version.
- Minimize sensitive content and use controlled investigation access.
- Combine production samples with repeatable offline evaluation.
- Alert on actionable service and control symptoms, and feed incidents into regression tests.
Frequently asked questions
Should we log every prompt and response?
Usually not. Start with metadata, identifiers and protected sampling. Full content requires a defined purpose, redaction, restricted access, retention and deletion because it may contain sensitive or hostile data.
What is the best hallucination metric?
There is no universal metric. Define unsupported claims for the task, evaluate against authoritative evidence, and segment by query type and consequence. Pair automated scoring with calibrated human review.
Is the model provider dashboard sufficient?
No. It covers provider requests and resource use, not retrieval permissions, prompt versions, tool authorization, human decisions, business outcomes or the rest of the application path.
Conclusion
LLM observability makes an AI service explainable to its operators. Correlate a user outcome with the exact retrieval, model, prompt, policy, tool and approval path; protect the evidence; evaluate representative results; and prepare actionable objectives and incident controls. When observations can be traced to a version and converted into a test or release decision, the team can improve quality, cost and safety without relying on anecdotes.