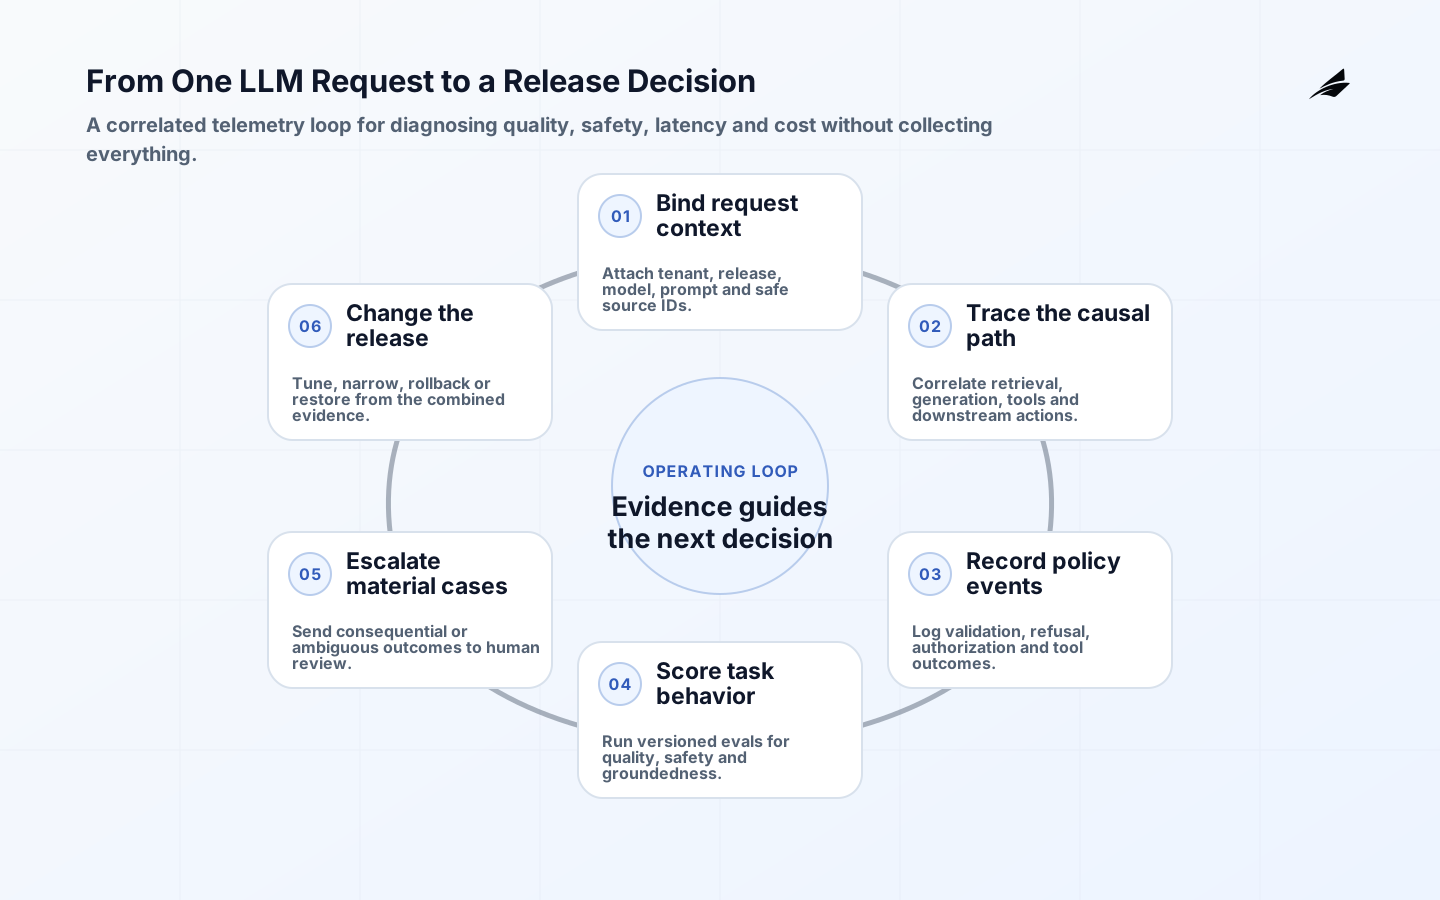
LLM observability is the discipline of making an AI feature explainable enough to operate. The team needs to know which request led to which output, which model and tool chain were involved, what context reached the model, where the cost came from and how the system behaves when the answer is wrong or unsafe. Without that, logs become noise and an evaluation report becomes a one-time artifact instead of a control loop.
For founders and engineering leaders, the practical goal is narrower: capture just enough telemetry to diagnose failures, verify quality, detect cost drift and support human review without turning every interaction into an unmanaged data lake. The checklist below organizes that work from the request contract through release gates and incident response.
What observability must answer
Observability should let the team answer four questions quickly. What happened? Why did it happen? What should we do now? What changed since the last good release? In an LLM workflow, those questions translate into model version, prompt version, retrieval source, tool call, output, human decision and cost. A dashboard that only shows token counts or a generic success rate is not enough because it cannot explain a bad answer or a drift in behavior.
The best signal set is the smallest one that can support those decisions. That usually means traces for causal paths, structured logs for events and policy decisions, metrics for trends and evaluation results for quality checks. Each signal has a job. If one signal is being asked to do everything, the team should redesign the instrumentation rather than add another chart.
| Question | Signal needed | Decision it supports |
|---|---|---|
| What happened | Trace plus structured log | Locate the failed step and the model or tool involved |
| Why did it happen | Trace correlation plus contextual attributes | See the request path and the context that shaped it |
| Is quality drifting | Evaluation result plus metric trend | Decide whether to tune, retrain or rollback |
| Is cost drifting | Token, latency and volume metrics | Decide whether to optimize prompts, routing or caching |
| Should a human intervene | Review queue and escalation log | Decide whether to block, approve or revise the workflow |
Define the telemetry contract before the first build
A telemetry contract states what the team will record, why it will record it, how long it will retain it and who may view it. Capture the request context at the boundary: user or service identity, tenant or account, model version, prompt template version, retrieval identifiers, tool calls and the release identifier. Decide which fields are safe to store in full, which must be redacted and which should be represented only as hashes or identifiers. The contract should also say when telemetry is sampled rather than fully captured.
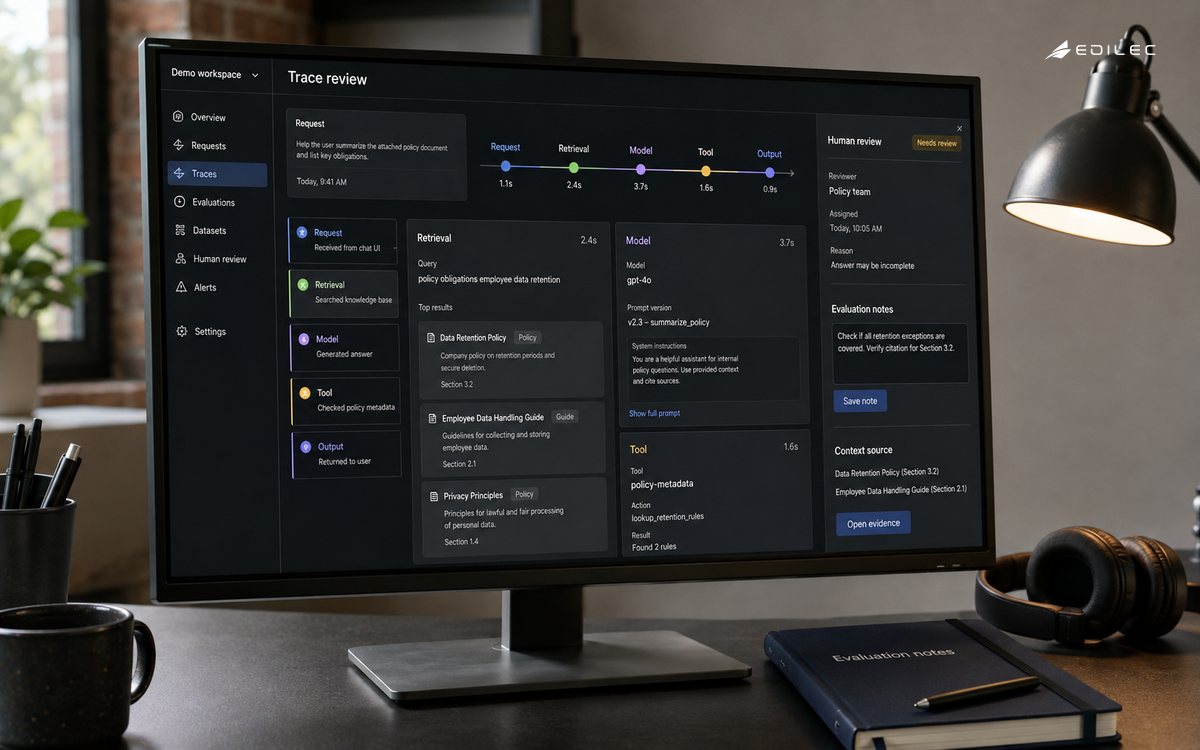
That contract protects the team from two bad outcomes. First, the team does not under-collect and lose the ability to diagnose failures. Second, the team does not over-collect and build a privacy or cost problem into the product. Make the boundary explicit for prompts, retrieved passages, tool outputs and human review notes. If a field could expose credentials, personal data or other sensitive content, exclude it or transform it before it lands in long-term storage.
| Event type | Fields worth keeping | Field to avoid by default |
|---|---|---|
| Request start | Identity, tenant, model, template and release | Raw secrets or full personal data |
| Retrieval step | Source identifiers, ranking order and freshness | Unbounded source text copies |
| Tool call | Tool name, input class, status and duration | Opaque payloads that hide the control point |
| Answer output | Outcome, citation set and refusal reason | Verbose output that duplicates all internal context |
| Human review | Reviewer decision, rule applied and escalation | Free-form notes with uncontrolled sensitive content |
Instrument traces, logs and metrics together
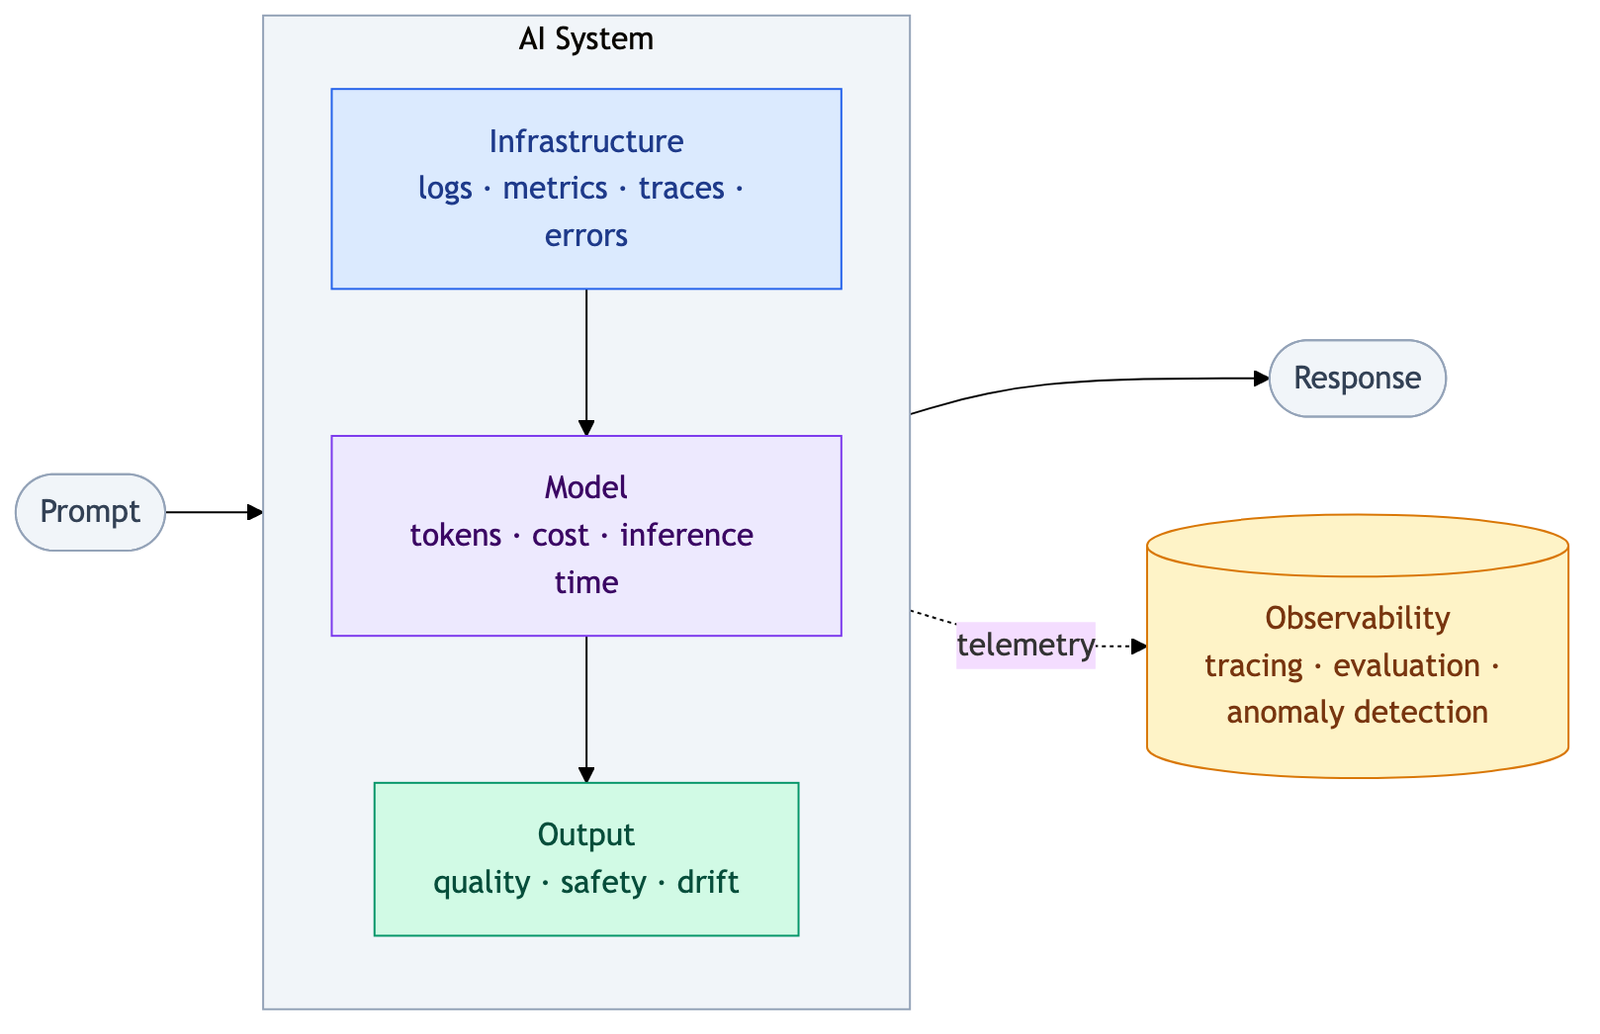
Traces show the causal path of one request across services and tool calls. Logs explain the event at each step. Metrics show the trend over time. For an LLM feature, traces should include retrieval, prompt assembly, model call, tool invocation, post-processing and human handoff when those steps exist. Logs should record policy decisions, refusals, validation failures and notable exceptions. Metrics should capture request volume, latency, output length, cost, error rate and the rate at which a human had to intervene.
Context propagation is what keeps those signals usable. Without it, the system cannot join a prompt, a retrieval call, a tool call and a review decision into one story. OpenTelemetry's model is helpful here because it makes correlation explicit rather than accidental. The practical rule is to give every meaningful operation an identity that survives the trip through the system. That identity becomes the thread that links diagnosis, review and optimization.
| Signal | What it tells you | What to watch out for |
|---|---|---|
| Trace | The path from request to answer or refusal | Too many spans can create noise without insight |
| Log | The event and policy decision at a step | Verbose logs can leak sensitive content |
| Metric | Trend, rate and volume across many requests | High-cardinality labels can raise cost fast |
| Context propagation | How request identity moves between services | Missing propagation breaks correlation |
| Baggage or attributes | Useful downstream context when handled carefully | Sensitive values can escape intended boundaries |
Add evals and human review
Evals turn observability into a quality loop. A good eval set includes representative easy cases, edge cases, unsafe inputs, stale context and adversarial prompts. The rubric should say what counts as a correct answer, a safe refusal, an acceptable citation and a serious failure. Keep the evals versioned so the team can see whether a prompt change, retriever change or model change caused the shift in results.
Human review is still needed when the output affects customers, money, access or compliance. The review flow should be simple enough to use during a live incident and consistent enough to produce comparable decisions over time. When reviewers disagree, record that disagreement instead of averaging it away. Disagreement is data. It shows where the rubric is underspecified or where the product boundary is not yet stable.
| Eval type | Purpose | Typical cadence |
|---|---|---|
| Golden set | Checks known good and known bad answers | Every model or prompt change |
| Safety eval | Tests refusals, policy compliance and abuse cases | Before pilot and after major changes |
| Retrieval eval | Checks whether the right sources are found | When corpus or ranking logic changes |
| Human review | Confirms high-impact or ambiguous cases | Continuous for sensitive workflows |
| Incident replay | Recreates a failure from production evidence | After a meaningful outage or defect |
Control cost and cardinality
Observability can become expensive quickly if the team logs every prompt verbatim, tags every metric with a user ID or stores all review artifacts forever. High-cardinality labels make metrics hard to aggregate and expensive to keep. Large unstructured logs make retrieval expensive and hard to secure. The answer is not to hide data. It is to keep the raw detail where it is useful, retain the smaller analytical facts where they are operationally valuable and discard or summarize the rest according to policy.
Build cost controls into the instrumentation design. Use sampling where full capture is not required. Separate short-term debug storage from longer-term audit storage. Prefer stable identifiers over raw text for routine dashboards. Keep a small set of team-owned signals that drive action, and push everything else into the investigation path. If a metric is not tied to a decision, it will eventually become an expensive decoration.
| Cost driver | Control | Warning sign |
|---|---|---|
| Verbose logging | Redact and structure logs before retention | Logs start to duplicate the prompt store |
| Metric cardinality | Limit labels to stable operational dimensions | Dashboards slow down as dimensions multiply |
| Trace volume | Sample routine traffic and keep full detail for incidents | Every request is captured even when the answer is routine |
| Storage growth | Tier data by investigation and audit need | Old data stays hot because no retention policy exists |
| Human review load | Escalate only material or uncertain cases | Review becomes a bottleneck for normal traffic |
Stage rollout and incident response
Start in shadow mode if possible. Let the observability stack record traffic without changing user outcomes. Then move to an internal pilot with a small set of users and a clear support path. The team should know what gets paged, what gets queued for review and what can be safely ignored. A rollout is ready for wider use only when the observability evidence is stable enough that the team can debug an issue without improvising new data collection during the incident.
Incident response for LLM features should include prompt regressions, retrieval failures, tool misuse, unsafe outputs, cost spikes and telemetry gaps. The playbook should say who can disable a tool, revert a prompt, narrow the corpus or switch to a safer fallback. It should also say how to capture the evidence needed to learn from the event without widening the blast radius. The aim is not zero failure. It is fast detection, controlled containment and durable learning.
| Stage | Evidence needed | Rollback trigger |
|---|---|---|
| Shadow | The stack records traces, logs and metrics as expected | Missing correlation or broken data capture |
| Internal pilot | Reviewers can judge outputs and act on issues | Repeated unsafe or unsupported answers |
| Canary | A small cohort shows stable quality and cost | Latency, drift or incidents exceed tolerance |
| General release | Ownership and alert routes are operating normally | No one can explain or fix the result path |
| Recovery | The team can revert prompt, model, tool or corpus changes | The fallback path is not proven in practice |
Measure quality and governance
Useful metrics link observability to product decisions. Track groundedness, refusal correctness, citation coverage, answer usefulness, review turnaround, tool failure rate, cost per successful task and time to detect a bad release. Do not chase a single number without context. A lower refusal rate can be bad if the model is guessing. A lower cost can be bad if the assistant has become too shallow to be useful.
Governance should be owned and versioned like code. Set a review cadence for eval suites, retention rules, dashboard definitions and alert thresholds. Tie each change to the model, prompt or workflow version that prompted it. That way the team can answer the most important leadership question after any incident: what changed, what evidence did we see and what did we decide to do next.
| Metric | Why it matters | Action if it moves |
|---|---|---|
| Groundedness | Shows whether answers rely on supported evidence | Tune retrieval or raise the refusal threshold |
| Citation coverage | Shows whether answers can be traced to sources | Improve source selection and answer assembly |
| Cost per task | Shows whether the system stays economically viable | Adjust routing, caching or prompt length |
| Review turnaround | Shows whether human escalation is workable | Simplify the review path or narrow the trigger |
| Time to detect drift | Shows how fast the team sees a broken release | Improve alerts and comparison baselines |
Key takeaways
- Treat observability as an operating control, not a logging project.
- Define the telemetry contract before the first request is instrumented.
- Use traces, logs and metrics together, then add evals and review for quality decisions.
- Control cardinality, retention and storage so telemetry stays affordable and useful.
- Build rollout and incident response so the team can detect, contain and learn from bad outputs.
Frequently asked questions
Do we need full traces for every request?
Not necessarily. Full traces are most useful for high-impact workflows, new releases and incident investigation. Routine traffic can often be sampled if the team still has enough evidence to diagnose trends and compare versions.
Should prompts and outputs be stored?
Only if the storage rule is justified by diagnosis, audit or review needs and the content is protected appropriately. Sensitive text should be minimized, redacted or transformed before long-term retention. Storing everything by default is usually a privacy and cost mistake.
Are evals enough on their own?
No. Evals are necessary but not sufficient. They show how a version behaves against a defined set of cases, while observability shows what happened in the real system. Both are needed to understand quality and drift.
How often should the observability setup be reviewed?
Review it whenever the model, prompt, corpus, tool chain or release process changes materially, and at a scheduled cadence even when nothing obvious changed. The point is to keep the telemetry aligned with the decisions the team actually needs to make.
Conclusion
LLM observability is useful when it shortens diagnosis, improves release confidence and keeps humans in control of consequential decisions. The team does not need unlimited telemetry. It needs the right signals, attached to the right context, with enough review and governance to turn a confusing assistant into an operable product. That is what makes the checklist worth implementing.