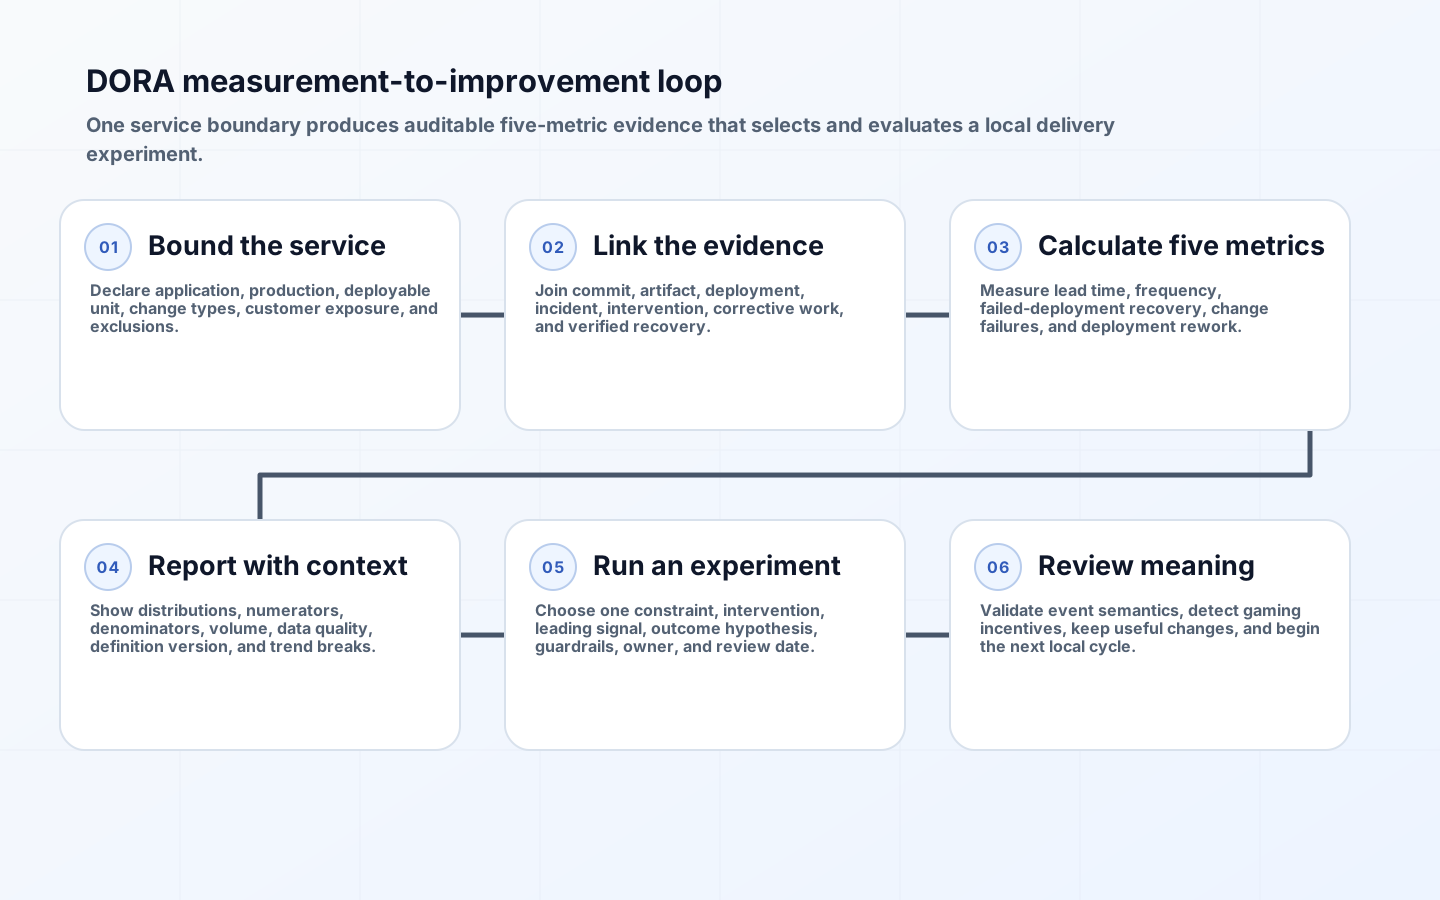
DORA metrics implementation should help a team find and test improvements in its delivery system. It should not produce a league table of unlike teams or reward changing labels. A service deployed continuously from a monorepo, a mobile client constrained by stores, and a regulated batch platform have different production boundaries and customer risks. Their trends can guide local action, but one raw number cannot rank their value or engineering quality.
As of July 13, 2026, DORA's current model contains five software delivery performance metrics, not the older four-key set. Throughput comprises change lead time, deployment frequency, and failed deployment recovery time. Instability comprises change fail rate and deployment rework rate. The implementation task is to define production events consistently for one application or service, connect evidence across tools, and use the measures in a learning loop.
Use the current five DORA metric definitions
DORA's official software delivery performance metrics guide was updated in January 2026 and explicitly describes five metrics. Change lead time runs from commit to successful production deployment. Deployment frequency counts application changes reaching production or measures time between them. Failed deployment recovery time measures recovery from a deployment requiring immediate intervention. Change fail rate is the ratio of deployments requiring immediate intervention. Deployment rework rate is the ratio of unplanned deployments made in response to production incidents.
This evolution matters. The older time-to-restore-service measure could include failures unrelated to a deployment; the newer recovery measure stays tied to software delivery. The added rework rate reveals unplanned corrective deployment load that a simple failure ratio can miss. DORA's metric history explains the move from four keys to five and the grouping into throughput and instability. Preserve definitions with metric version and effective date in your catalog.
| Metric | Numerator or interval | Denominator or anchors | Required links |
|---|---|---|---|
| Change lead time | Elapsed time per production change | Commit time to first successful production deployment | Commit, artifact, deployment, service |
| Deployment frequency | Successful production deployments or interval between them | Service and measurement window | Deployment, environment, service |
| Failed deployment recovery time | Elapsed time to restore after failed deployment | Failure start and verified recovery | Deployment, incident, mitigation |
| Change fail rate | Failed deployments | Eligible production deployments | Deployment and immediate intervention |
| Deployment rework rate | Unplanned corrective deployments | Eligible production deployments | Incident, corrective deployment, intent |
Define the application, production, deployment, and change boundary
Write a metric contract for each measured application or service. Name repositories, deployable units, production environments, customer population, release mechanisms, configuration and data changes included, emergency work, and exclusions. A deployment should be a production change to the measured service, not every pipeline retry, pod restart, or regional replica. If one logical release fans out to twenty cells, decide whether the unit is release, cell deployment, or customer exposure and apply it consistently.
Define change identity through artifact provenance. A build should carry source revisions; deployment records should carry artifact digest, service, environment, release id, start, completion, result, and exposure. For a release train containing many commits, calculate per-change lead time or a stated aggregate distribution rather than assigning only the oldest commit. Keep feature activation distinct from binary deployment but measure it when that is the real customer-delivery boundary.
Construct an auditable event model across delivery and incidents
Ingest immutable events from version control, build, deployment, feature management, incident, and rollback systems. Normalize identities while retaining source ids and timestamps. Use event time and ingestion time, deduplicate retries, and model corrections. Maintain lineage from dashboard cell to source event. Tool configuration changes can alter metrics, so version adapters and monitor missing-event rates instead of assuming automation is objective.

Link a failed deployment only when evidence supports causal or immediate operational association. Record failure criteria such as rollback, hotfix, feature disablement, customer-impacting remediation, or emergency configuration reversal. Avoid counting a preproduction pipeline failure in the production denominator. For recovery, name the end condition: customer SLI restored and mitigation verified, not merely an incident ticket moved to resolved. Reopened incidents should not quietly erase elapsed time.
| Case | Recommended treatment | Why | Sensitivity view |
|---|---|---|---|
| Progressive rollout halted before customer impact | Count deployment; classify failure only if immediate intervention criterion applies | A production change and control action occurred | Show pre-impact catches separately |
| Same artifact to ten regions | One logical release plus regional rollout events | Avoid inflating frequency by topology | Report rollout duration and regional failures |
| Feature flag enabled days later | Measure deployment and activation separately | Code movement differs from value exposure | Compare activation lead time |
| Rollback followed by fixed forward deploy | Original is failed; corrective deploy is rework | Preserves both instability signals | Show recovery strategy |
| Database-only production migration | Include when it changes measured service behavior or risk | Delivery is broader than binaries | Tag change type |
| Routine dependency incident | Exclude from failed deployment recovery unless deployment-triggered | Keep causal boundary coherent | Track service recovery elsewhere |
Report distributions and context instead of a single score
Use medians and tail percentiles for lead and recovery times, counts and intervals for frequency, and explicit numerators with denominators for rates. Display the eligible deployment count because a 50% failure rate from two deployments has different evidence than 5% from two hundred. Slice by service, change type, release path, and period, but guard low-volume privacy and statistical volatility. Mark tool migrations, freezes, and boundary changes directly on trends.
Do not average rates across services without weighting and interpretation. A portfolio view can show distributions, confidence, data quality, and contextual groups, but improvement ownership stays with the service team. DORA warns that context differs and the metrics are best applied to one application or service at a time. Google Cloud's DevOps capability catalog connects outcomes to capabilities such as continuous delivery, testing, loosely coupled architecture, and streamlined change approval; those capabilities are candidate interventions, not points in a composite score.
Turn signals into local improvement experiments
Start with a constraint observed by the delivery team: long review queues, flaky integration tests, manual environment preparation, large release batches, slow rollback, or unclear ownership. State a hypothesis, intervention, leading measure, DORA outcome expected to move, customer and quality guardrails, owner, and review date. For example, reducing pull-request batch size may shorten lead time and failure recovery while change fail rate guards against superficial speed.
Use the baseline and a sufficiently long comparison that captures normal demand. Preserve seasonality and incident context. A before-and-after trend does not prove causality, but it can support a local decision when combined with qualitative evidence and process observation. DORA's 2025 guidance on choosing measurement frameworks recommends starting with the decisions measurement should inform and recognizes value in combining frameworks. Pair delivery measures with product outcomes, reliability, quality, and developer experience when the question requires them.
Prevent gaming through design, incentives, and review
Gaming is often a rational response to target pressure. If teams are ordered to deploy daily, they can split harmless no-op changes. If change fail rate affects compensation, incidents can be relabeled or fixes moved outside the deployment system. Remove individual and cross-team ranking, do not tie bonuses to raw thresholds, and reward validated improvement work. Keep definitions visible and let teams challenge bad data without suppressing real failures.
Add anomaly checks for sudden denominator growth, micro-deployments without customer or operational change, missing incident links, reclassification spikes, unplanned work marked planned, and service-boundary churn. Review samples with engineers and incident managers. Audit is not punishment; it validates whether the metric still represents work. When a definition changes, backfill where feasible or draw a break in the time series. Never splice incomparable periods into a smooth executive trend.
DORA metrics implementation takeaways
- Use DORA's current five metrics and version the definitions rather than repeating the retired four-key model.
- Define production, service, change, deployment, failure, rework, and recovery before building dashboards.
- Link source, artifact, deployment, incident, and corrective work with auditable event identities.
- Show distributions, numerators, denominators, data quality, and context instead of one portfolio score.
- Use metrics to select and assess local capability experiments with customer and quality guardrails.
- Reduce gaming by removing high-stakes raw targets and investigating semantic data drift openly.
DORA metrics implementation FAQ
Are there four or five DORA software delivery metrics?
There are five in DORA's current January 2026 guidance: change lead time, deployment frequency, failed deployment recovery time, change fail rate, and deployment rework rate. Older material describes four keys, and 2021 used reliability as a broader fifth outcome; label historical dashboards carefully.
Can leaders compare teams with DORA metrics?
They can compare trends and investigate contextual patterns, but raw rankings of unlike services are misleading and invite gaming. Use portfolio views to find support needs and systemic constraints, not to grade individuals or declare one domain superior.
Should every service target daily deployment?
No. Improve the ability to make small, safe changes on demand, then choose release cadence according to product and operational context. A mandated count can increase meaningless deployments without improving customer value or recoverability.
Conclusion
DORA measures become useful when their event semantics are more important than their dashboard polish. Define one service boundary, implement the current five metrics with lineage and honest denominators, and use movement to evaluate a specific improvement hypothesis. Kept away from rankings and compensation, the measures can support the conversation they were designed for: how a team delivers better software more safely and efficiently.