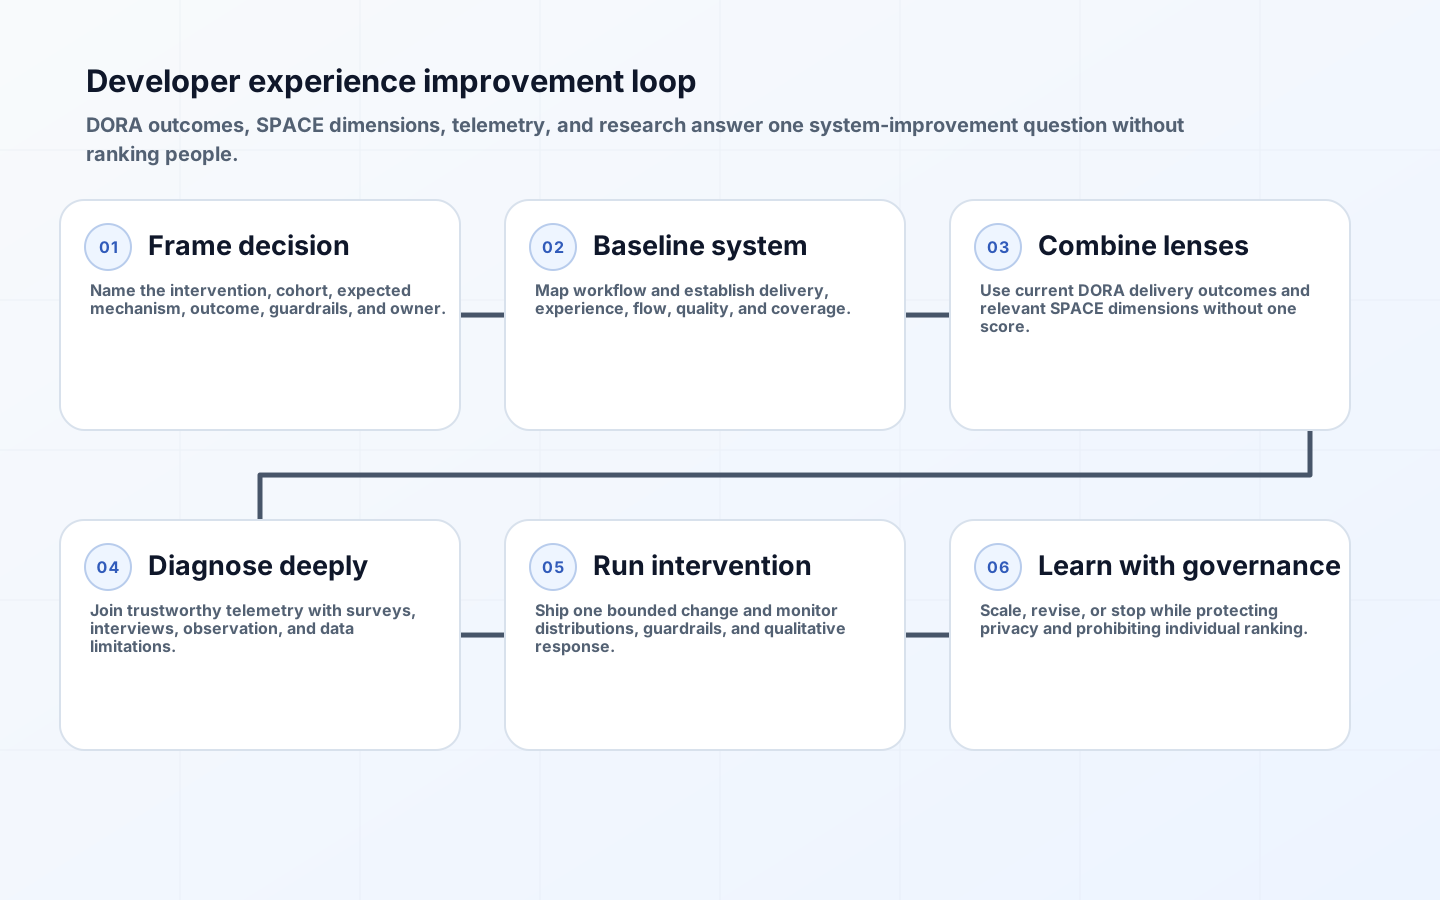
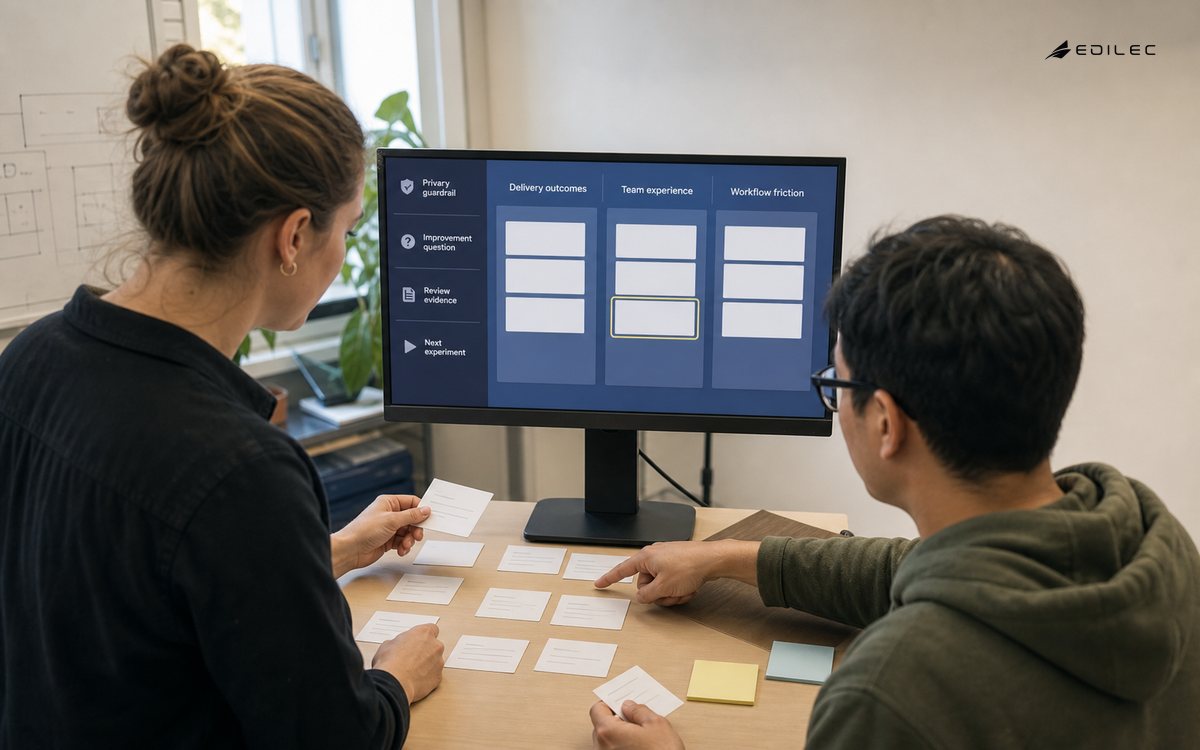
A dashboard of commits, pull requests, story points, and coding time can be precise while answering the wrong question. Software work includes problem framing, collaboration, review, operation, learning, and risk reduction; visible repository activity is only a partial trace. A sound design for developer experience metrics DORA SPACE programs starts with an improvement question, measures teams and systems in context, combines outcomes with perceptions, and prohibits individual productivity rankings.
The frameworks contribute different lenses. DORA's current guidance identifies five software delivery performance metrics describing throughput and instability for an application or service. SPACE argues that developer productivity is multidimensional and cannot be represented by one metric or by activity alone. They are complementary, not ingredients for one composite score. Use DORA to examine delivery outcomes and SPACE to prevent blind spots in satisfaction, performance, activity, communication, and efficiency.
Begin with a decision and theory of change
State the intervention, affected population, expected mechanism, outcome, guardrails, and decision. Example: reducing CI queue delay for mobile teams should shorten commit-to-production lead time by reducing waiting, without increasing failed deployments, rework, or after-hours load. That statement suggests system telemetry, delivery outcomes, and a short experience survey. 'Measure engineering productivity' does not identify a decision and invites metric collection without limits.
Map the workflow and identify constraints before selecting measures. A slower lead time may come from review queues, test reliability, environment wait, approval, release batching, or operational caution. Each needs a different diagnostic. Keep outcome measures relatively stable while allowing diagnostic measures to change as bottlenecks move. Record definitions and data quality so a trend is not mistaken for behavior when an integration changed.
Combine DORA and SPACE without collapsing them
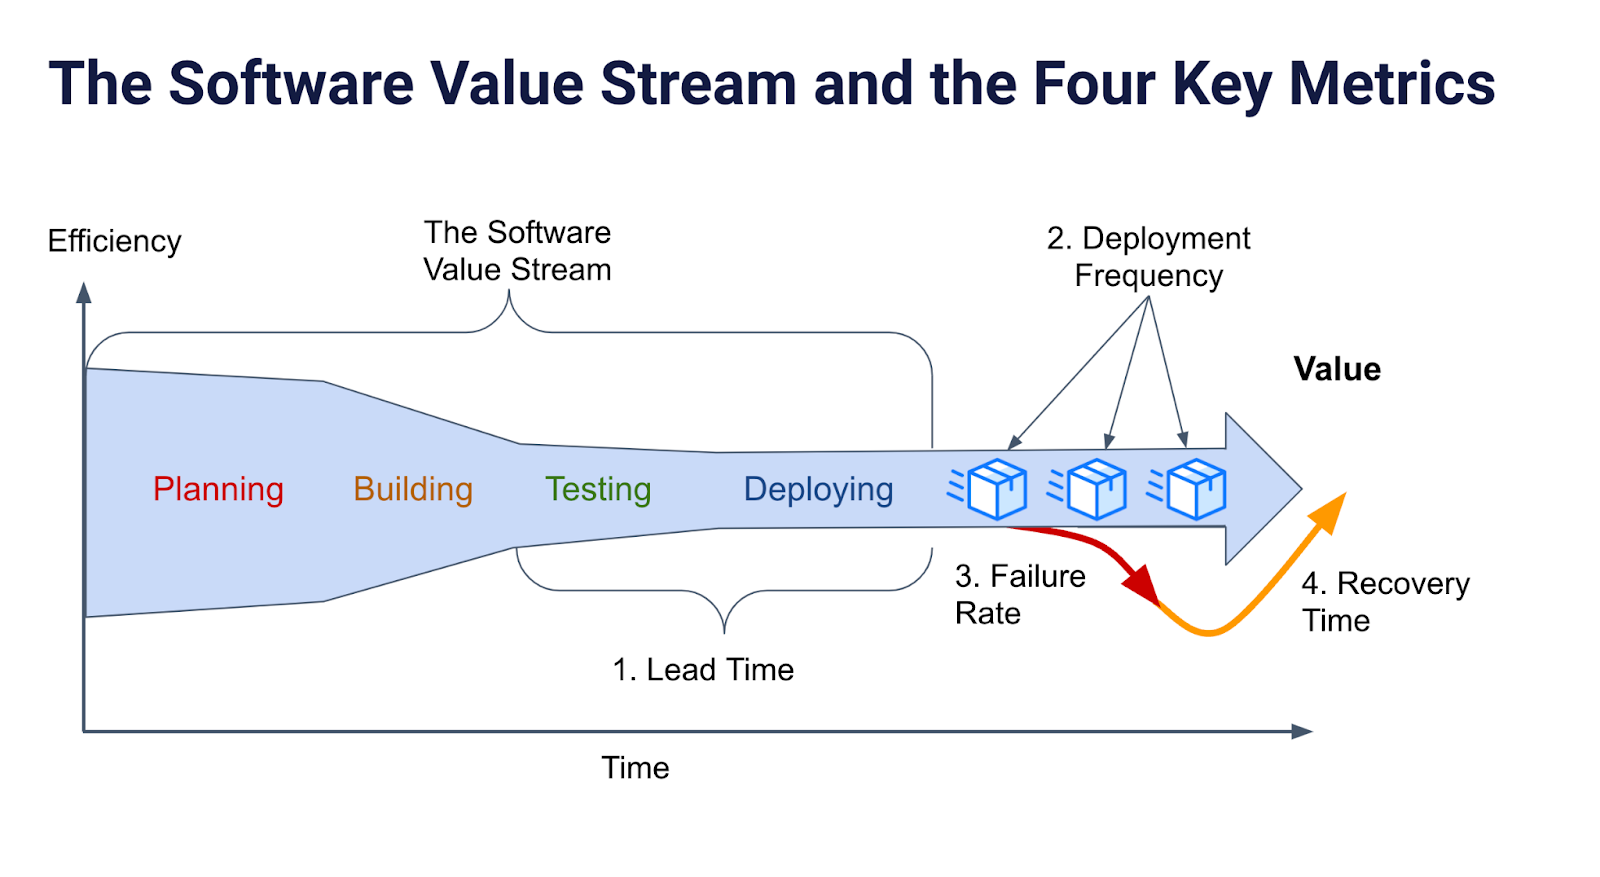
Current DORA delivery metrics are change lead time, deployment frequency, failed deployment recovery time, change fail percentage, and deployment rework rate. DORA groups them into throughput and instability and recommends applying them in the context of one application or service. Use them to understand a delivery system over time, not to compare unlike teams or set universal quotas. A mainframe product and a web service can both improve without converging on the same cadence.
SPACE covers Satisfaction and well-being, Performance, Activity, Communication and collaboration, and Efficiency and flow. Select measures from multiple dimensions and from both perceptions and behavior. Do not attempt to fill every cell. A build-platform intervention might use perceived build confidence, successful change outcomes, build attempts, cross-team support handoffs, and queue or retry time. The pattern protects against optimizing one observable signal while degrading the human system.
| Lens | Example measure | What it can indicate | What it cannot prove |
|---|---|---|---|
| DORA throughput | Change lead time distribution | How quickly changes traverse delivery | Individual effort or feature value |
| DORA instability | Change fail percentage and recovery time | Delivery reliability and recovery capability | Root cause without diagnosis |
| SPACE satisfaction | Confidence and friction survey item | Experienced quality and change over time | Objective workflow duration alone |
| SPACE communication | Blocked handoffs or review clarity | Coordination cost | Quality from message count |
| SPACE efficiency | Wait time, interruptions, retries | Flow constraints and toil | Whether all waiting is waste |
| SPACE activity | Builds or reviews as context | Workload and process events | Productivity by volume |
Choose the correct unit and comparison
Measure delivery at the service or application level and experience at a team or sufficiently aggregated cohort. Define team membership changes, service boundaries, bots, automated deployments, rollbacks, hotfixes, and failed events. Use medians and tail percentiles where distributions matter. Compare a cohort with its own baseline and intervention timing; use matched groups cautiously when context is similar. Organization-wide rankings convert architectural and business differences into false performance judgments.
Keep individual identifiers only where technically necessary for joins and access control, then aggregate or remove them. Small teams need suppression thresholds so survey or workflow data cannot identify a person. Managers should not receive a drill-down from team lead time to one developer's commits. The measurement charter should name prohibited uses, retention, access, correction, and escalation when data is misapplied.
Build trustworthy flow and delivery telemetry
Define event semantics across source control, CI, deployment, incidents, and work systems. Choose the start and end for change lead time, distinguish production from test deployments, connect failures to changes with explicit evidence, and define recovery completion. Handle monorepos, multiple services per repository, cherry-picks, rollbacks, feature flags, and batch releases. Publish coverage and unmatched-event rates; a number without join quality is not decision-grade.
Decompose elapsed time into active and waiting intervals only when timestamps support the distinction. Review wait, queue delay, test duration, approval delay, environment provisioning, and deployment time are actionable diagnostics. Avoid interpreting keyboard or IDE activity as active value creation. Sampling and workflow studies can reveal work that systems do not record, including architecture, mentoring, incident coordination, and customer discovery.
| Signal | Definition control | Quality check | Anti-gaming guardrail |
|---|---|---|---|
| Deployment frequency | Successful production release for one service | Deduplicate retries and automation | Pair with failure and rework |
| Change lead time | Commit enters production | Report unmatched commits and batching | Do not reward trivial change splitting |
| Failed deployment recovery | Customer-impacting failed change to recovery | Link incident and deployment evidence | Do not suppress failure declaration |
| Change fail percentage | Eligible changes causing defined failure | Consistent denominator and severity | Pair with learning culture |
| Deployment rework | Unplanned corrective deployment after release | Define time and causal window | Review planned follow-ups separately |
| Experience survey | Stable item for named workflow | Response rate and anonymity | Never attach to individual evaluation |
Use surveys and interviews as operational evidence
Ask short, specific, repeated questions about a workflow: ease of completing a deployment, confidence in test feedback, ability to recover, frequency of interruption, or clarity of ownership. Use consistent scales and optional free text. Report response rate and uncertainty, and avoid interpreting tiny shifts as meaningful. Rotate diagnostic modules while keeping a small stable core for trends.
Interview people at different points in the measured distribution, including teams that do not use the platform. Observe a task where possible. Qualitative work tests the proposed mechanism: queue telemetry may look healthy while developers wait to obtain an environment through an untracked conversation. Close the loop by publishing findings, chosen improvements, and what was deliberately not inferred. Repeated surveys without visible action create fatigue and lower data quality.
Design dashboards for learning, not judgment
Organize the view around the improvement question. Show intervention dates, outcome trend, guardrails, diagnostic decomposition, cohort coverage, and qualitative summary. Preserve separate measures instead of a weighted productivity index. Allow service owners to annotate incidents, migrations, seasonal peaks, and boundary changes. Context should be visible beside the graph, not supplied after a ranking has already circulated.
Use thresholds for investigation only where evidence supports them, and prefer control charts or historical ranges to red-and-green league tables. Access should follow purpose: teams can explore their workflow; platform teams see aggregated product diagnostics; executives see outcome and investment trends without individual drill-down. Exported data needs the same use restrictions as the dashboard.
Create explicit anti-gaming and privacy controls
Any target changes behavior. Pair speed with stability, volume with value and quality, self-service with user effort, and automation with incident outcomes. Audit sudden improvements for definition or pipeline changes. Invite teams to report perverse incentives without penalty. Do not reward deployment frequency in isolation or require a minimum number of commits, reviews, or tickets. Those policies encourage activity theater and punish careful or complex work.
Establish a measurement council including engineering, developer experience, privacy or legal where relevant, and representative teams. Approve new data collection, review access, retire unused data, and investigate misuse. EngThrive, published by Microsoft Research in 2026, is a current example of combining outcome-oriented metrics, diagnostics, telemetry, and surveys with thriving as a guardrail; organizations should still adapt any model to their own decisions and governance.
Run a six-to-twelve-week improvement loop
- Agree on one system constraint, affected cohort, and expected mechanism.
- Baseline delivery, experience, flow, quality, and data coverage.
- Collect interviews or observation to test the diagnosis.
- Ship one bounded change with intervention timing and guardrails.
- Review distributions and qualitative evidence, not only averages.
- Decide whether to scale, revise, stop, or investigate, then document learning.
Key takeaways
- Start with an improvement decision and theory of change.
- Keep DORA outcomes and SPACE dimensions visible rather than combining a score.
- Measure services, teams, and systems in context, never individual productivity.
- Join telemetry with surveys, interviews, and data-quality evidence.
- Pair every target with guardrails and enforce privacy and prohibited-use rules.
Frequently asked questions
Are there four or five DORA metrics?
Current DORA guidance, updated in 2026, describes five: change lead time, deployment frequency, failed deployment recovery time, change fail percentage, and deployment rework rate. Older materials commonly refer to the Four Keys, so definitions and source dates should be explicit.
Can SPACE produce a single productivity score?
That would undermine its multidimensional purpose. Select complementary measures from relevant dimensions and inspect tradeoffs. A single score hides whether satisfaction, quality, collaboration, activity, or flow changed and invites arbitrary weighting.
Should teams be compared with each other?
Usually not. Architecture, release needs, risk, product demand, and boundaries differ. Compare a team or service with its own baseline and use carefully matched cohorts to evaluate an intervention, while discussing context and uncertainty.
Conclusion
Developer experience measurement is useful when it helps teams remove a real constraint and verify that delivery, quality, collaboration, and well-being improve together. DORA supplies outcome measures; SPACE protects the multidimensional view; telemetry and research explain the mechanism. Strong governance keeps that learning system from becoming a scoreboard that damages the work it claims to improve.