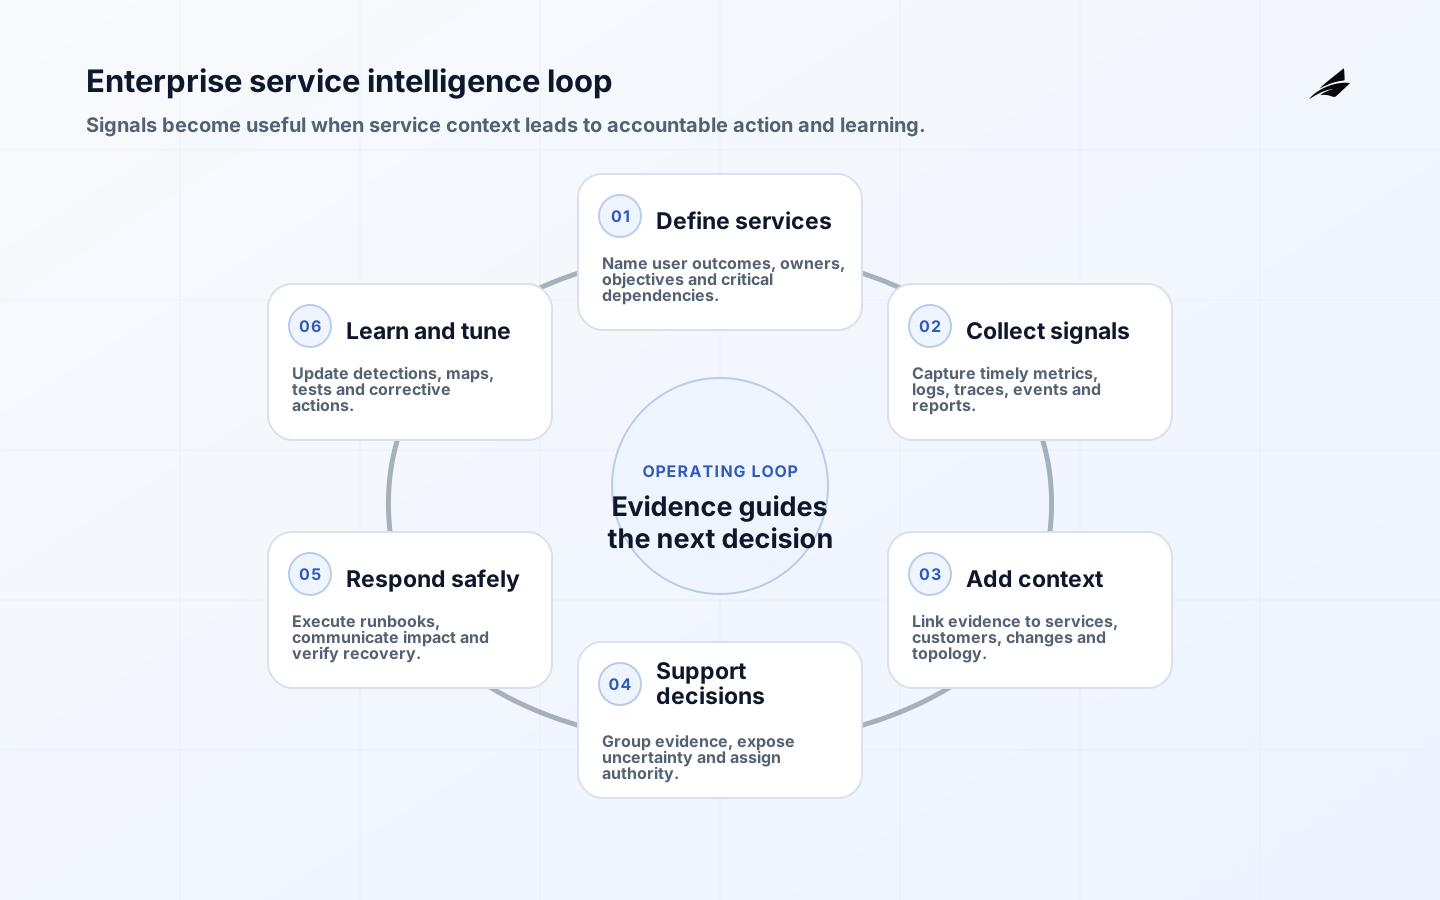
Service intelligence for enterprise operations turns technical and workflow data into decisions about business services. It connects telemetry, service ownership, dependencies, incidents, changes, requests, customer impact and recovery actions. The goal is not another dashboard or an opaque prediction score. It is earlier recognition of meaningful degradation, faster diagnosis, safer response and evidence that service reliability is improving.
Use this FAQ with the service intelligence delivery plan, the implementation checklist and the related enterprise service intelligence guide. Together they help service owners, platform teams and operations leaders move from disconnected tools to a governed operating capability.
What is service intelligence for enterprise operations?
Service intelligence combines four layers. Signals describe what systems and users are experiencing. Context maps those signals to services, owners, customers, locations, changes and dependencies. Analysis groups and prioritizes evidence, while workflow assigns a human or approved automation to act. A useful implementation can answer: which service is affected, how severe is the impact, what changed, who owns the decision, which runbook applies, and whether recovery restored the user outcome.
It often joins IT service management and IT operations management. ServiceNow describes its Service Operations Workspace as a unified experience for multiple ITSM and ITOM workflows. That product is one implementation, not the definition. An enterprise can build service intelligence across other tools if identifiers, ownership, event semantics, decision rights and evidence remain coherent.
| Layer | Core question | Minimum useful output |
|---|---|---|
| Signals | What happened and when? | Timestamped metrics, logs, traces, events or user reports with source identity |
| Service context | What business capability and users are affected? | Owned service, dependency path, criticality and customer impact |
| Analysis | What evidence is related and how confident are we? | Grouped event, probable contributors, uncertainty and supporting observations |
| Workflow | Who can decide and act? | Assigned case, severity, runbook, approvals, timeline and communication |
| Learning | Did action work and what should change? | Outcome, review, corrective work and updated detection or documentation |
How is service intelligence different from observability?
Observability is a foundation. OpenTelemetry’s current signals documentation covers traces, metrics, logs and baggage, with profiles also represented in its concepts. Those signals help engineers understand distributed behavior. Service intelligence adds enterprise context and action: the affected payroll service, the change owner, the service objective, the executive communication threshold and the recovery authority. It also incorporates user contacts and workflow records that may not originate as application telemetry.
Monitoring checks known conditions; observability supports investigation of conditions not fully predicted. DORA’s monitoring and observability guidance emphasizes customer-experienced state, business and system metrics, production debugging and access to information across interacting services. Service intelligence should preserve that exploratory depth. Reducing rich telemetry to a single health color can make a console tidy while removing the evidence engineers need.
What data model is required?
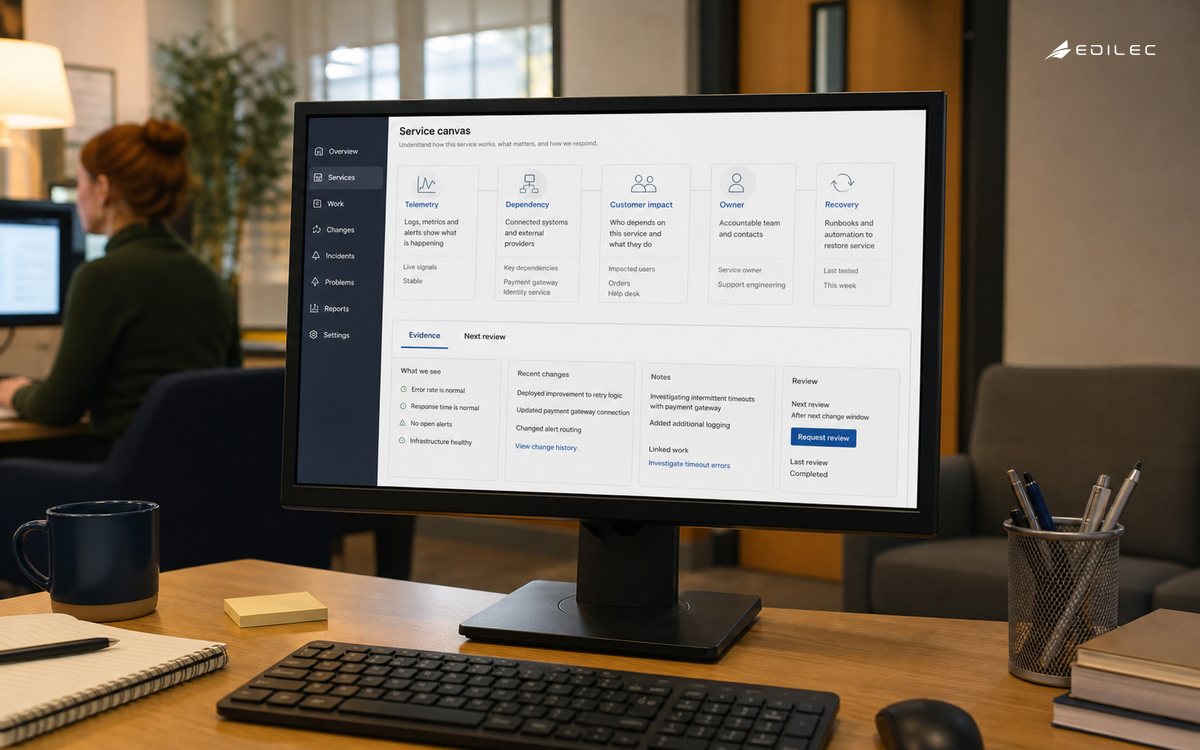
Start with a service model small enough to maintain. Define customer-facing or workforce services, owners, criticality, objectives and a limited set of dependencies needed for impact analysis. Use stable identifiers across telemetry, deployment, configuration and case tools. Discovering infrastructure can seed the model, but discovery does not know the business meaning or decision owner. Require service teams to validate their records and set an expiry or review cadence for critical relationships.
Event schemas need source, observed time, event time, resource, environment, service, severity, state, correlation identifiers and links to raw evidence. Preserve provenance when normalization or enrichment changes a record. Synchronize clocks and document latency. Avoid putting sensitive payloads into logs by default. Define retention from operational, security, privacy and investigation needs. A service graph built from stale configuration and ungoverned tags can create confident but wrong impact statements.
- Choose five to ten critical services and name accountable business and technical owners.
- Define service objectives and user journeys before selecting alerts or machine-learning features.
- Standardize service, environment, release and correlation identifiers across signals and workflow tools.
- Map only the dependencies needed to make impact or routing decisions, then measure their freshness.
- Create a severity model that combines user impact, scope, duration, safety or regulatory consequence and workaround.
- Preserve raw evidence and transformation provenance so an analyst can challenge every recommendation.
How should correlation and AIOps be used?
Begin with deterministic correlation: shared service, resource, trace, topology, deployment or time window. Measure precision and missed relationships using reviewed incidents. Add statistical anomaly detection or learned grouping only for a defined decision. Every model should have an owner, input contract, version, evaluation set, threshold rationale and fallback. Display evidence and uncertainty; operators must be able to separate observation from inference and override a recommendation without losing the audit trail.
Anomaly does not equal incident. Traffic at a new high may be healthy, while a small increase in checkout failure can be critical. Combine model output with service objectives, seasonality, deployment context and user impact. Test cold starts, missing signals, topology drift and changing workloads. Track false positives, false negatives, time saved and operator acceptance. Retire analyses that create noise or no longer support a decision. Intelligence is valuable only when it improves the operating outcome.
How does intelligence become safe action?
A recommendation needs a destination, owner and clock. Route actionable alerts to the team that can change the affected service, attach impact and supporting evidence, and link the relevant runbook. Deduplicate without hiding distinct failure modes. Define acknowledgement, escalation and handoff behavior for follow-the-sun teams. ServiceNow’s current ITOM workspace documentation illustrates an operator view that includes assigned, team and unassigned alerts; the ownership distinction is essential whatever platform is used.
Automate low-risk, reversible actions with narrow authority: collect diagnostics, scale within approved limits, restart a stateless worker, suppress a known duplicate, or open a case. Require human approval for actions with uncertain blast radius, data loss, customer interruption or regulatory consequence. Record the trigger, inputs, action, result and rollback. Use circuit breakers and rate limits. A runbook that has never been exercised under realistic permissions should not be promoted directly into autonomous remediation.
How should incidents and changes be connected?
Link deployments and configuration changes to affected services with time, version, owner and rollback information. During an incident, show recent changes as evidence, not assumed causes. The incident commander needs one timeline that distinguishes observations, hypotheses, decisions, actions and communications. NIST SP 800-61 Revision 3’s incident response recommendations integrate response across broader cybersecurity risk management; enterprise service intelligence should similarly support preparation, detection, response, recovery and improvement rather than only alert triage.
After restoration, preserve a blameless but accountable review. Identify contributing technical and organizational conditions, detection gaps, decision delays, failed safeguards and what limited impact. Corrective actions need owners and due dates. Update service maps, runbooks, tests, alerts and change controls. Track repeat incidents by failure mode, not only by ticket category. The review is complete when learning changes the system, not when a meeting document is filed.
| Measure | Definition | Caution |
|---|---|---|
| Signal coverage | Critical service components emitting required usable signals | A high count does not prove semantic quality |
| Actionable alert rate | Alerts that led to a documented useful action divided by reviewed alerts | Do not label ignored alerts actionable |
| Detection time | Impact start to verified detection | Requires an agreed impact-start estimate |
| Recovery time | Impact start to restoration of the user outcome | Separate temporary mitigation from full recovery |
| Impact | Affected users or transactions multiplied by duration and severity | Use business context rather than ticket count |
| Repeat failure rate | Incidents recurring from a previously identified failure mode | Requires consistent review taxonomy |
What security, privacy and resilience controls matter?
Telemetry can contain credentials, personal data, customer content and architecture details. Minimize collection, redact at source where possible, encrypt transport and storage, separate tenants and environments, and restrict query and export. Use attributable access and audit high-risk searches. Protect collectors, agents, pipelines and automation credentials because they cross trust boundaries. Establish integrity and availability objectives for the intelligence platform; an attacker or outage that blinds monitoring during an incident creates compounded risk.
Design graceful degradation. Critical services need local safeguards and direct monitoring when the central platform is unavailable. Queue telemetry within bounded limits, expose ingestion lag, and prevent delayed data from appearing current. Back up configuration, service definitions, runbooks and case evidence. Test provider and network outages. OpenTelemetry’s observability primer emphasizes adequate instrumentation for answering new questions; resilience tests should verify that the evidence remains available when operators need it most.
What is a practical rollout plan?
Select one critical service with known pain, committed owners and available telemetry. Baseline incident volume, detection, recovery and alert quality. Build the minimum service model, normalize identifiers, instrument one or two user journeys, connect change events, and route a small set of alerts. Run game days and observe operator behavior. Improve data and workflow before adding predictive features. Expand by reusable patterns, not by connecting every source at once.
Price and schedule depend on service count, telemetry volume, existing instrumentation, topology quality, tool integrations, retention, security, operating hours and automation depth. Separate platform licensing and consumption from implementation and ongoing tuning. Require exportable configurations, schemas, detections, runbooks, evaluation records and service models. A provider should demonstrate how it measures noise, model quality and operational outcomes, and how the customer can challenge or disable an automation.
Key takeaways
- Build service intelligence around user outcomes, accountable services and decisions rather than tool consolidation.
- Preserve rich telemetry and provenance while adding service, change and workflow context.
- Evaluate correlation and AIOps against reviewed incidents, with uncertainty and operator override visible.
- Automate reversible actions first and retain human authority for consequential decisions.
- Measure detection, recovery, impact, alert usefulness and repeat failures to prove operational improvement.
Frequently asked questions
Does service intelligence require a perfect CMDB?
No. Start with validated ownership and critical dependencies for a bounded service. Automate discovery where it is reliable, expose freshness, and let service teams correct business context. Waiting for an enterprise-wide perfect model delays value; treating unverified discovery as truth creates dangerous impact and routing errors.
Should a generative AI assistant lead incident response?
It can summarize evidence, retrieve runbooks or draft communications, but authority should follow risk and demonstrated performance. Ground responses in approved sources, show citations, protect sensitive context, evaluate representative incidents and require review for consequential actions. The incident commander remains accountable for decisions and should have a non-AI fallback.
How is return on investment demonstrated?
Compare a baseline and post-rollout cohort for detection delay, recovery, impact, on-call effort, repeat incidents and avoided tool or integration cost. Attribute cautiously: process, staffing and application changes may contribute. Include the cost of telemetry, licenses, tuning and operating the platform. The strongest case shows better service outcomes, not simply more ingested events.
Conclusion
Service intelligence for enterprise teams becomes useful when signals retain technical depth and gain reliable business context, ownership and action. Start with a few critical services, establish identifiers and objectives, connect changes and incidents, and test decisions through realistic exercises. Once operators trust the evidence and workflow, correlation and automation can scale without turning uncertainty into invisible risk.