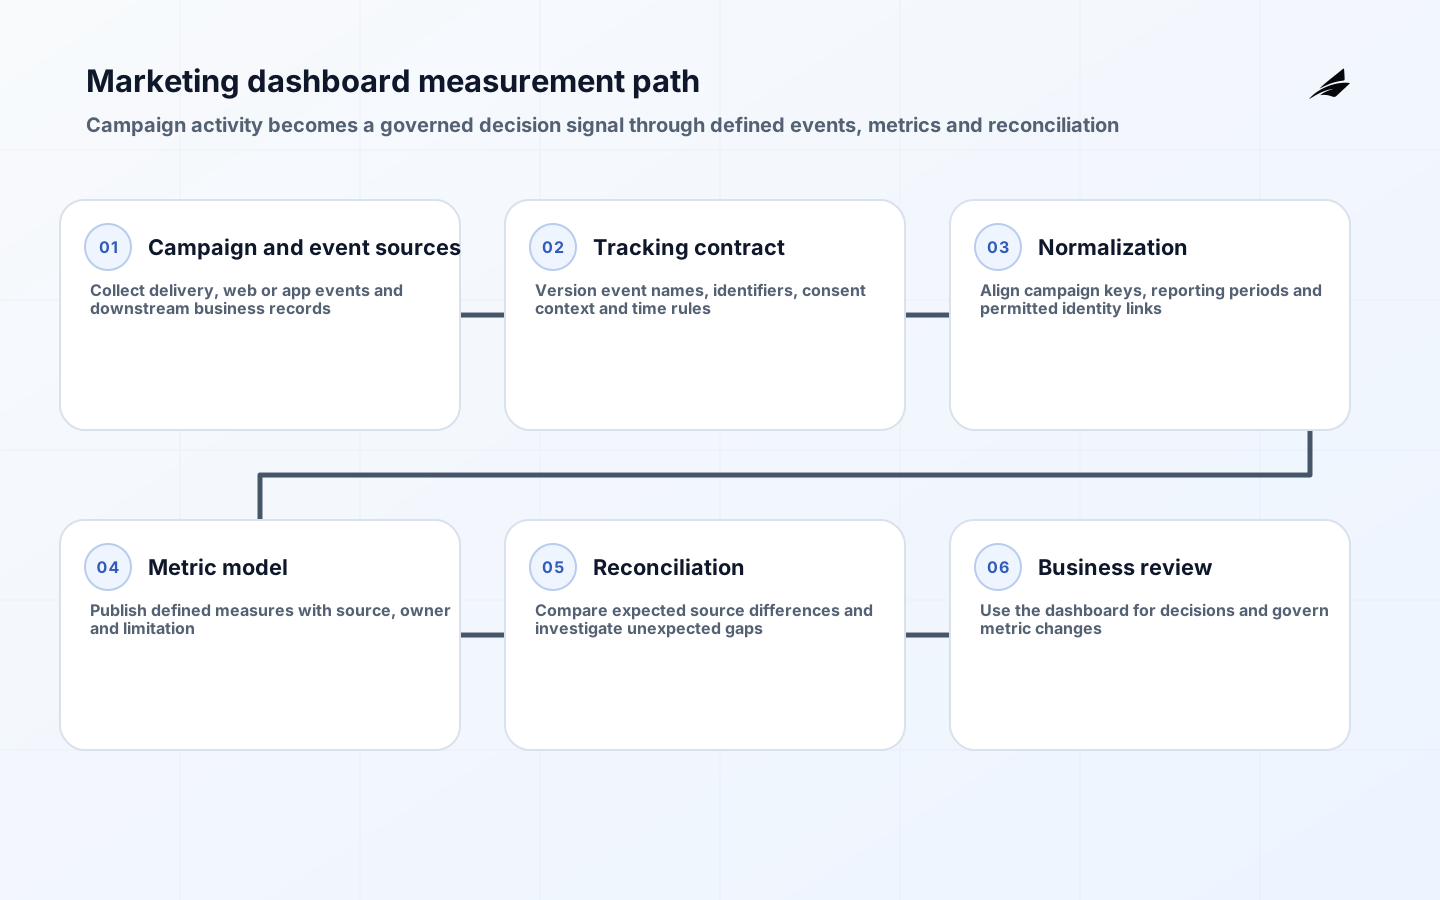
A marketing analytics dashboard is useful when it helps a team decide what to continue, change, investigate or stop. It is less useful when it merely puts every available channel number in one place. Start with the decisions the dashboard must support: allocating budget, checking campaign delivery, finding a broken conversion path, comparing acquisition quality or explaining a change in demand. Those decisions determine the grain, freshness and reconciliation needs of the data. A channel manager may need daily delivery detail; a leadership review may need a stable weekly view of spend, outcomes and confidence. Trying to make one screen satisfy every question usually produces a crowded report with unclear ownership.
Start with decisions and metric contracts
Define each primary metric as a contract rather than a label. A contract states its business question, numerator, denominator, time basis, attribution rule, source, owner, known exclusions and acceptable refresh delay. For example, "qualified lead" cannot be trusted merely because it appears in a chart; marketing and sales need a shared definition of qualification, the system that assigns it and the date that counts. The same care applies to spend, conversions, revenue and return measures. A dashboard should expose when a metric is preliminary, modeled, unavailable or affected by a consent or tracking change. That honesty gives users a basis for action instead of a false sense of precision.
| Decision | Metric contract needed | Question to settle |
|---|---|---|
| Budget allocation | Spend, outcome and attributed value | Which cost date and attribution rule are used? |
| Campaign optimization | Delivery, engagement and conversion events | Which event qualifies as the outcome? |
| Funnel investigation | Stage counts and transition rate | Which system is authoritative for each stage? |
| Sales alignment | Lead quality and accepted demand | How are rejected or duplicate records treated? |
| Executive review | Trend and confidence annotation | What changes make comparison invalid? |
Map sources, identities and time
Marketing information crosses several systems with different identifiers and clocks. Advertising platforms record delivery and cost. Web and app instrumentation records events. CRM or product systems may record downstream qualification, revenue or retention. A dashboard needs a deliberate mapping among campaign identifiers, tracking parameters, landing pages, account or lead records and calendar boundaries. Do not assume that a person can be joined across systems because the records look similar. Identity resolution must respect consent, policy and the actual identifiers available. Where a complete join is not defensible, report the measures separately and explain the limitation rather than manufacturing a single journey.

Time is a frequent source of quiet disagreement. Platform reports may use account time zones, event dates, processing dates or adjusted conversion dates. Finance may close costs on a different schedule than media delivery. Record the canonical reporting time zone, the period-close behavior and the maximum expected delay for each source. A week-over-week comparison may be misleading when a campaign was renamed, a tracking tag changed or data arrived late. Build annotations and a change log into the report so a reviewer can distinguish a commercial movement from a measurement movement.
| Source layer | Typical contribution | Control to add |
|---|---|---|
| Ad platform | Spend, impressions, clicks and campaign metadata | Capture account, currency and extraction date |
| Tagging and analytics | Sessions and consented events | Version event names and data-layer fields |
| CRM or sales system | Lead status, opportunity and revenue context | Define deduplication and stage authority |
| Warehouse or model | Conformed dimensions and calculated measures | Test joins, freshness and metric logic |
| Dashboard | Reviewable presentation and filtering | Show data date, filter scope and caveats |
Build a reliable measurement path
The reliable path begins before a campaign launches. Use a tracking plan that names events, required parameters, owners, environments and validation cases. A data layer can give tags a consistent way to receive event information, but it does not prove that the event matches business reality. Test the complete path: the intended action occurs, the event is emitted once, the platform receives the expected fields, the downstream model recognizes it and the dashboard shows it under the right date and campaign. Keep raw extracts or reproducible source queries long enough to investigate discrepancies. Without a route back to source evidence, a dashboard becomes difficult to correct after a tag deployment or vendor change.
Design the dashboard for review
Give the overview page a limited job: show the decision-level metrics, trend, comparison period, filters and confidence notes. Put diagnostic detail in separate views for channel, campaign, audience, landing experience or pipeline stage. This structure helps users move from "what changed" to "where should we investigate" without requiring every question to be answered on the first screen. Labels should name the measure and period plainly. Tooltips or accompanying definitions can explain calculation details, but the visual should not hide a complex metric behind a familiar word. Empty states matter too: a blank result should say whether a filter found no records, the source has not refreshed or access is unavailable.
Access and distribution are part of dashboard design. Determine who may see cost, customer, pipeline and revenue data, whether exports are allowed and how shared links behave. Avoid solving a permission issue by producing a separate manual spreadsheet for each audience; that spreads conflicting versions of the same metric. Instead, use governed access, audience-specific views and a clear owner for published definitions. The dashboard should help a business review happen faster, but it must preserve the ability to trace a number to its model and source when someone questions it.
Reconcile and run the review cadence
Reconciliation is an operating practice, not a one-time launch exercise. Establish which numbers should agree across systems, which are expected to differ and what difference requires investigation. Spend may reconcile to a platform export within the selected date rule, while conversions may differ between an analytics tool and a CRM because the systems observe different points in the journey. Document those expected differences. When an unexpected gap appears, assign an owner and retain the diagnosis: tracking break, mapping issue, late data, duplicate record, policy change or legitimate business change. This library of known conditions reduces repeated debate at review meetings.
| Signal | Why it matters | Response owner |
|---|---|---|
| Source freshness | Shows whether the current period is complete | Data operations owner |
| Event volume change | Can reveal a tag or product-path change | Instrumentation owner |
| Join rate | Shows whether cross-system context is weakening | Data model owner |
| Metric reconciliation gap | Makes accounting or definition differences visible | Metric owner |
| Dashboard usage | Shows whether the report supports a real workflow | Business review owner |
Run a short cadence with the people who can change the system. Marketing should own priorities and interpretation, data teams should own the model and data health, and sales or finance should participate where their records define an outcome. Review metric changes before releasing them, archive obsolete views and retire fields that no longer support a decision. The dashboard will remain credible only if its definitions evolve through an accountable change path rather than through silent formula edits.
Handle consent and measurement change
Consent choices, browser behavior, tag releases and advertising platform changes can alter what a dashboard observes. Product and marketing teams should agree who approves a measurement change, which events are affected, how the release is tested and how the dashboard is annotated afterward. Do not backfill an estimated comparison without clearly identifying the method and limitation. In some cases the correct response is to begin a new comparable series; in others, a documented recalculation is appropriate. The governing principle is that users should be able to see when a trend represents customer behavior and when it represents a changed observation method.
Privacy review needs to be part of the data contract, not a final checkbox. Record the purpose for identifiers and events, minimize collection, control access to detailed records and align retention with approved policy. Analysts often need aggregate patterns, not unrestricted personal-level exports. Building that distinction into the model and dashboard reduces later rework and makes it easier to give business teams useful information without broadening data exposure merely for reporting convenience.
Key takeaways
- Build the dashboard around recurring business decisions, not around every available channel field.
- Give every headline measure a definition, owner, source, time basis and stated limitation.
- Model campaign identifiers, customer identity and time zones explicitly before joining systems.
- Test the measurement path from user action through source data, model and displayed result.
- Use reconciliation and review to keep the dashboard trustworthy as campaigns and tracking change.
Frequently asked questions
Can one dashboard become the source of truth for every marketing number?
It can be the governed presentation for agreed metrics, but the underlying systems still remain authoritative for their own records. The dashboard should make its source and calculation visible enough for a reviewer to investigate differences.
How fresh should marketing dashboard data be?
Freshness should match the decision. Campaign delivery monitoring may need frequent updates, while financial or pipeline review may require a settled period. State the expected delay instead of implying that every number is real time.
Which attribution model is best?
There is no universally best model. Select a model that matches the question, available evidence and decision horizon, then keep it explicit and consistent enough for comparisons to remain meaningful.
Conclusion
A marketing dashboard becomes an operating asset when it joins a well-defined question to a reviewable measurement path. Define the metrics, map the sources, preserve limitations and give changes an owner. That produces a report business teams can use to decide, while still leaving them a clear route back to the evidence when the numbers deserve scrutiny.