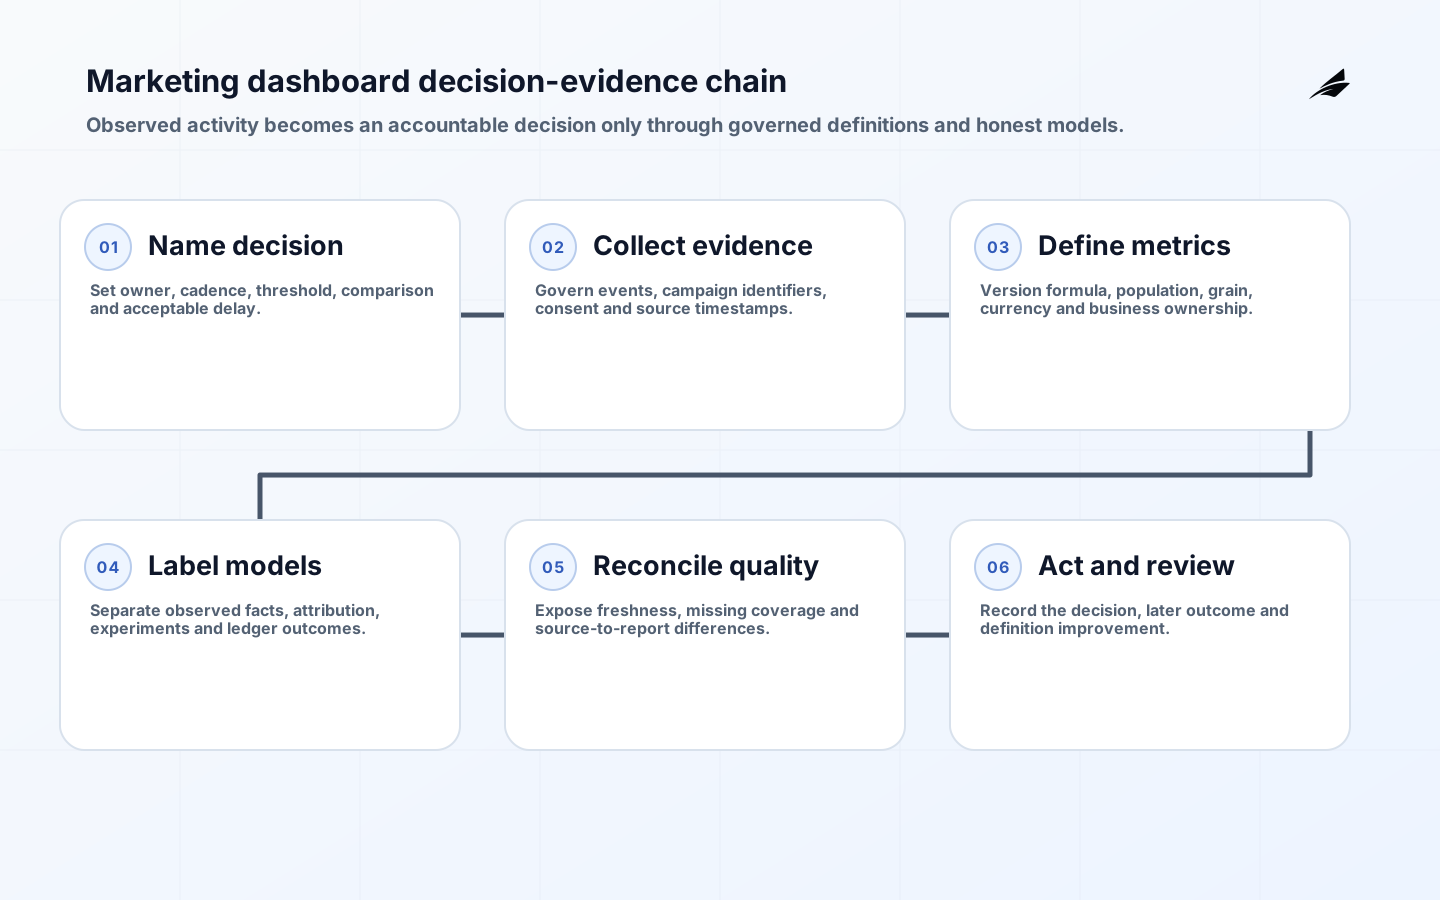
A marketing analytics dashboard should help a named team decide what to continue, stop, investigate or test. It should not reproduce every chart available in advertising platforms. A dependable implementation reconciles spend with qualified business outcomes, defines each metric, distinguishes observed data from attribution models, exposes freshness and quality, and preserves enough detail to explain material changes.
This checklist is for marketing, sales, finance, data and product teams preparing a dashboard or replacing spreadsheet reporting. Begin with recurring decisions, then design collection, transformation and presentation around them. Use each checkpoint as an acceptance test with an owner and evidence. The result should make uncertainty visible rather than hiding it behind polished visualizations.
1. Define decisions, audiences and reporting horizons
List decisions such as reallocating weekly budget, pausing broken acquisition, investigating lead quality, comparing cohort retention or reconciling monthly spend. Name the owner, cadence, acceptable delay, comparison and threshold that changes action. Daily monitoring and quarterly planning need different evidence. Acceptance evidence should identify the responsible owner, the source record, the expected result and the decision required when the result is missing.
Separate monitoring from analysis. Monitoring needs stable signals and alert conditions; analysis needs segmentation and drill-through. Executives, channel managers and finance teams have different responsibilities. Do not force every audience into one overloaded canvas. Test the normal path, boundary conditions and a realistic failure path; a successful demonstration alone does not prove the marketing decision product is ready.
| Decision | Governed measure | Context |
|---|---|---|
| Shift campaign budget | Qualified outcome per spend | Lag, saturation, capacity and uncertainty |
| Investigate funnel loss | Stage conversion by eligible cohort | Definition version and maturation |
| Review lead quality | Accepted or retained outcome by source | Identity-match rate and sales process |
| Reconcile month end | Booked spend and recognized outcome | Currency, invoice status and restatement |
2. Write a contract for each material metric
Define business meaning, formula, grain, population, time basis, currency, owner and limitation. Lead, qualified opportunity, active customer and revenue should come from authoritative lifecycle systems. Platform conversions remain useful for optimization but should not silently become the business ledger. Keep the definition and its effective date with the implementation so later teams can explain why historical and current behavior differ.
Version definitions and mark effective dates. Publish denominator and eligible population for rates. Keep source-specific metrics beside governed metrics when they serve different purposes. Place short definitions, freshness and attribution labels near the chart rather than in a separate document. Make exceptions visible in the same operating workflow instead of routing them to private spreadsheets or undocumented support messages.
3. Govern events, identifiers, consent and retention
Create an event plan with name, trigger, properties, identity, purpose, owner and prohibited data. Use consistent campaign and creative identifiers across ads, URLs, analytics and CRM. Validate tags before release and monitor missing or unexpected values. Use progressive exposure and explicit stop conditions so the team can learn from production without placing the entire estate at risk.
Treat browser, app, server and imported events as separate evidence. Define deduplication and precedence when the same conversion arrives through several paths. Product settings do not replace privacy analysis; apply minimization, consent, retention and access controls across warehouse copies and exports. Measure the business completion time and error consequence, not only component uptime or the number of tasks closed.
4. Connect spend to authoritative business outcomes
Land source extracts, then normalize accounts, campaigns, currencies, time zones and identifiers. Maintain mappings with effective dates instead of overwriting history. Join interactions to leads, orders or subscriptions using approved keys and measure unmatched records. Preserve identifiers, timestamps and version information across handoffs so reconciliation can distinguish delay, duplication and correction.
Model late outcomes so they update the correct cohort without rewriting touch history. Preserve refunds, cancellations and qualification changes. Provide a path from every displayed number to source records and transformation versions. A semantic layer centralizes calculation but does not replace business ownership. Document the recovery sequence and exercise it with representative state before relying on it during a live incident.
5. Label attribution as a model
State the model, eligible channels and lookback window. Google documents that attribution settings can change event-scoped reports and assign fractional credit. Keep platform-reported, cross-channel and business-system outcomes distinct, and never add incompatible platform conversions as though they share one model. Apply least privilege to people and services, and record material administrative actions with enough context for later review.

Use experiments, geo tests or suitable causal methods for high-value questions when feasible. Display population, period and uncertainty. Marketing-mix models need adequate history and specialist review. Explain which lens informs each decision. Review this control when scope, integrations, users or obligations change; a launch-time decision should not become a permanent assumption.
| Evidence | Answers | Limitation |
|---|---|---|
| Observed event | What instrumentation recorded | Collection and identity can be incomplete |
| Platform attribution | How one platform assigns outcomes | Model and observation are platform-specific |
| Cross-channel model | How shared rules distribute credit | Depends on identity and assumptions |
| Experiment | Incremental effect for a tested population | Power, execution and scope constrain use |
| Business ledger | What entered the authoritative process | Arrives later and requires reconciliation |
6. Expose freshness, completeness and reconciliation
Automate schema, uniqueness, accepted-value, referential-integrity, missing-identifier, timestamp and join-loss checks. Reconcile spend to invoices or exports and outcomes to CRM, order or subscription records. Publish last successful load, source coverage and incidents. Separate a commercial promise from the operational mechanism and evidence that will make the promise dependable.
Google states that Analytics processing can take 24 to 48 hours and attribution credit can change as processing continues. Label intraday views provisional. Define freshness by decision and preserve correction history so users understand why prior totals changed. Give users a clear degraded state and next action instead of allowing partial data or failed automation to appear complete.
7. Design an accessible decision interface
Lead with period, freshness and data health, then present a small outcome hierarchy. Use target, prior comparable period, forecast or experiment group intentionally. Provide exact-value tables and never encode status by color alone. Automate repeatable verification where it shortens feedback, while retaining accountable human judgment for consequential ambiguity.
Follow WCAG 2.2 for keyboard access, focus, labels, contrast, zoom and predictable interaction. Make drill-through retain filters and prevent comparisons across incompatible currencies, populations or attribution windows. Design mobile views around monitoring tasks rather than shrinking the analyst workspace. Version configuration with code and deployment records so a defect can be reproduced, contained and corrected without guesswork.
8. Roll out and govern the dashboard as a data product
Deliver one decision view end to end and run it in parallel with the current process. Investigate material differences. Train users to read attribution, freshness and quality indicators. Establish intake for new measures so urgent requests do not bypass ownership. Define a small set of leading and lagging measures, then remove metrics that have no owner or operating response.
Version transformation code and dashboard configuration. Monitor incidents, unused views, repeated exports, definition disputes and reversed decisions. Hold metric-governance review separately from campaign performance, and retire charts that have no owner or action. Review connector and platform limits explicitly so a vendor-side processing change does not silently alter governed business reporting.
Run a decision-based dashboard acceptance review
Acceptance should use real decision scenarios, not a tour of charts. Ask a channel owner to investigate a spend anomaly, a sales leader to explain a lead-quality shift and finance to reconcile a closed period. Observe whether each person can identify the metric definition, reporting population, attribution model, freshness and source trail without analyst intervention. Record ambiguous labels, broken drill-through and missing context as product defects rather than training issues.
- Reconcile provider spend, CRM outcomes and finance totals for a closed period.
- Verify campaign, currency, timezone and identity mappings at boundary cases.
- Test stale, partial, empty, permission-denied and corrected-data states.
- Confirm keyboard use, zoom, table alternatives and non-color status cues.
- Publish owner, definition version, refresh status and incident contact.
After launch, sample decisions rather than only page views. Determine whether the dashboard caused the intended action and whether later information reversed it. A repeated reversal can indicate immature cohorts, weak attribution labels or ungoverned corrections. Feed those findings into metric contracts and reporting cadence so the dashboard becomes more reliable, not merely more elaborate.
Key takeaways
- Start with recurring decisions, owners and acceptable delay.
- Govern formulas, populations, grains and definition changes.
- Separate observed facts, attributed credit, experiments and ledgers.
- Reconcile spend and outcomes while exposing source coverage.
- Operate the dashboard as an accessible, versioned data product.
Frequently asked questions
Does a marketing dashboard need real-time data?
Only when an action benefits from it, such as detecting broken collection or uncontrolled spend. Budget, quality and retention decisions often need mature cohorts and reconciled outcomes. Label real-time values provisional and do not use them as a substitute for complete daily or monthly reporting.
Is return on ad spend enough?
No. ROAS depends on attribution, revenue definition, margin, lag and customer quality. Use it with contribution, retention, capacity and incrementality evidence where relevant. Publish the formula and eligible population rather than comparing platform values as though they share one model.
Should the dashboard copy every platform metric?
No. Keep source metrics needed for channel optimization and bring governed outcomes into the shared model. Copying every field increases cost, privacy exposure and confusion. Include a measure when a named user can explain what decision it may change and who owns it.
Conclusion
A marketing analytics dashboard is a decision product built on governed evidence. Its credibility comes from traceable definitions, honest attribution, visible data health, privacy controls and reconciliation with authoritative business records. Visual polish matters only after those foundations are sound.
Begin with one budget or funnel decision. Trace every value to collection, transformation, definition and owner, then test the view against a real period. Expand only after users can explain the number, challenge its assumptions and act responsibly.