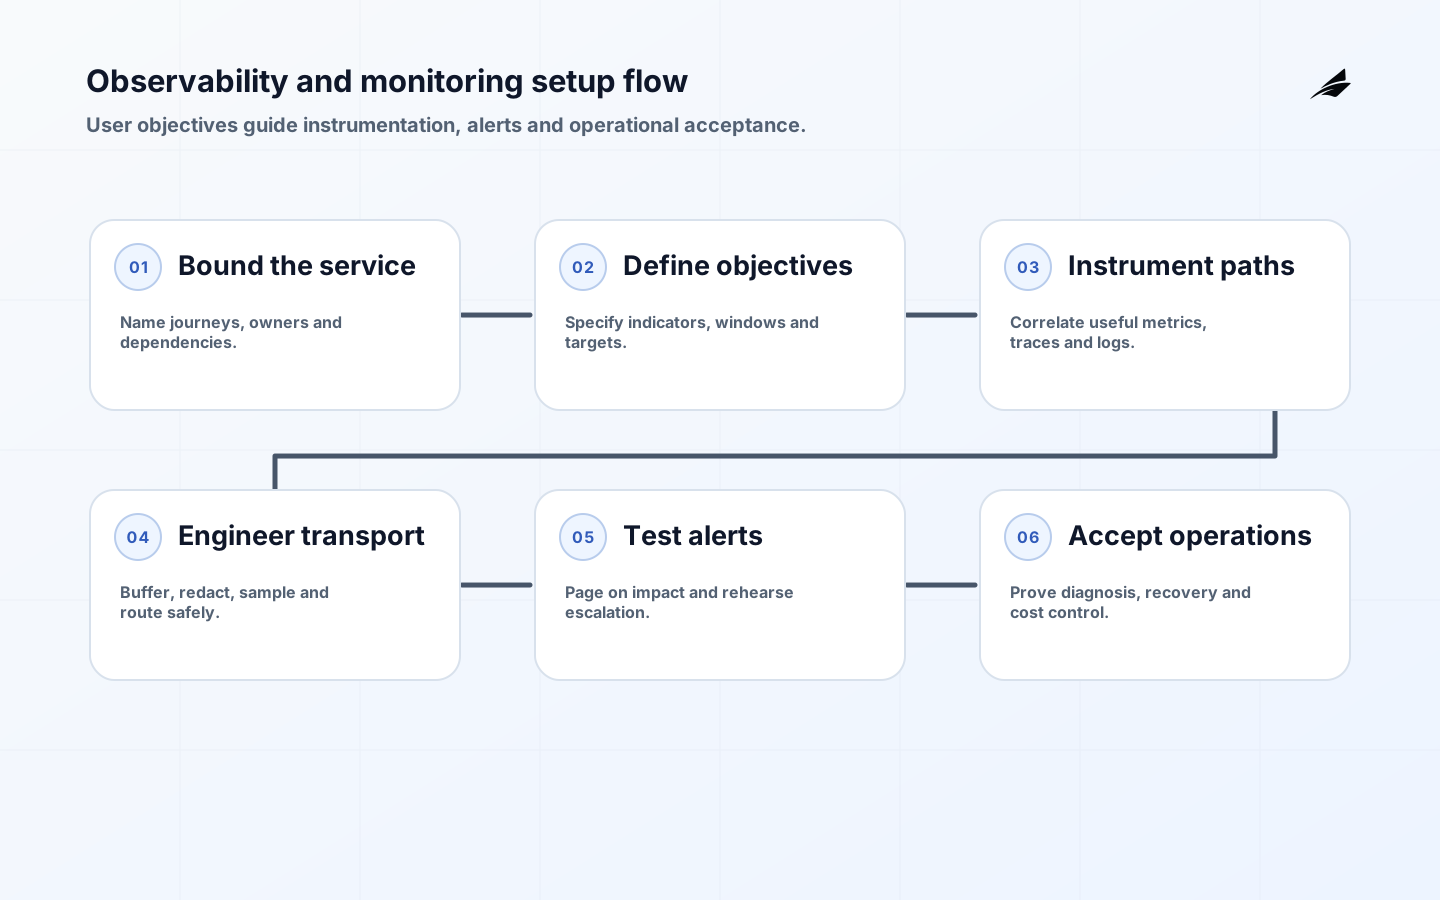
An observability and monitoring setup is complete when a team can recognize user harm, investigate it across dependencies and take a safe action before the evidence disappears. Buying a telemetry backend or installing agents is only an early step. This implementation checklist moves from service objectives through instrumentation, collection, alerts, response and acceptance. Pair it with Edilec's production observability guide, observability FAQ and cognitive infrastructure checklist.
OpenTelemetry's observability primer distinguishes observing a system through its outputs from merely owning monitoring tools. Its signals documentation covers traces, metrics, logs and context. Use these as interoperable building blocks, then connect them to decisions through Google SRE service-level objectives. The right design depends on the service and its users; collecting every available field is neither necessary nor responsible.
Define the service and monitoring boundary
List the user journeys, APIs, jobs, queues, data stores, third parties, regions and devices that form the service. Name the owner and on-call path. For each journey, describe success, unacceptable delay, incorrect output and dependency failure. Include client-side measurements where server health can hide a broken user experience. Record current detection and investigation gaps from recent incidents rather than beginning with a generic dashboard inventory.
Choose a small set of service-level indicators and specify numerator, denominator, exclusions, window, source and owner. Availability may need correctness as well as successful status codes. Latency should use distributions or percentiles appropriate to the journey, not an average that hides a slow tail. Define an initial objective and response policy. An SLO should drive a decision about reliability work, release pace or incident response.
| Checklist area | Required decision | Acceptance evidence | Owner |
|---|---|---|---|
| Journey | What users need to complete | Synthetic and real-user path | Product owner |
| Indicator | How good service is measured | Versioned SLI specification | Service owner |
| Signal | What explains indicator change | Instrumentation map | Engineering lead |
| Alert | When a human must act | Runbook and exercise | On-call owner |
| Retention | How long evidence remains useful | Policy and deletion test | Data owner |
Instrument useful signals consistently
Instrument request entry and exit, important internal operations, asynchronous handoffs and state changes. Add stable resource attributes such as service name, environment, version and region. Use the OpenTelemetry semantic conventions where available so teams do not invent conflicting names and units. Propagate trace context across supported boundaries, but treat baggage and attributes as data flows: prevent secrets, personal data and unbounded customer values from spreading through headers and telemetry.
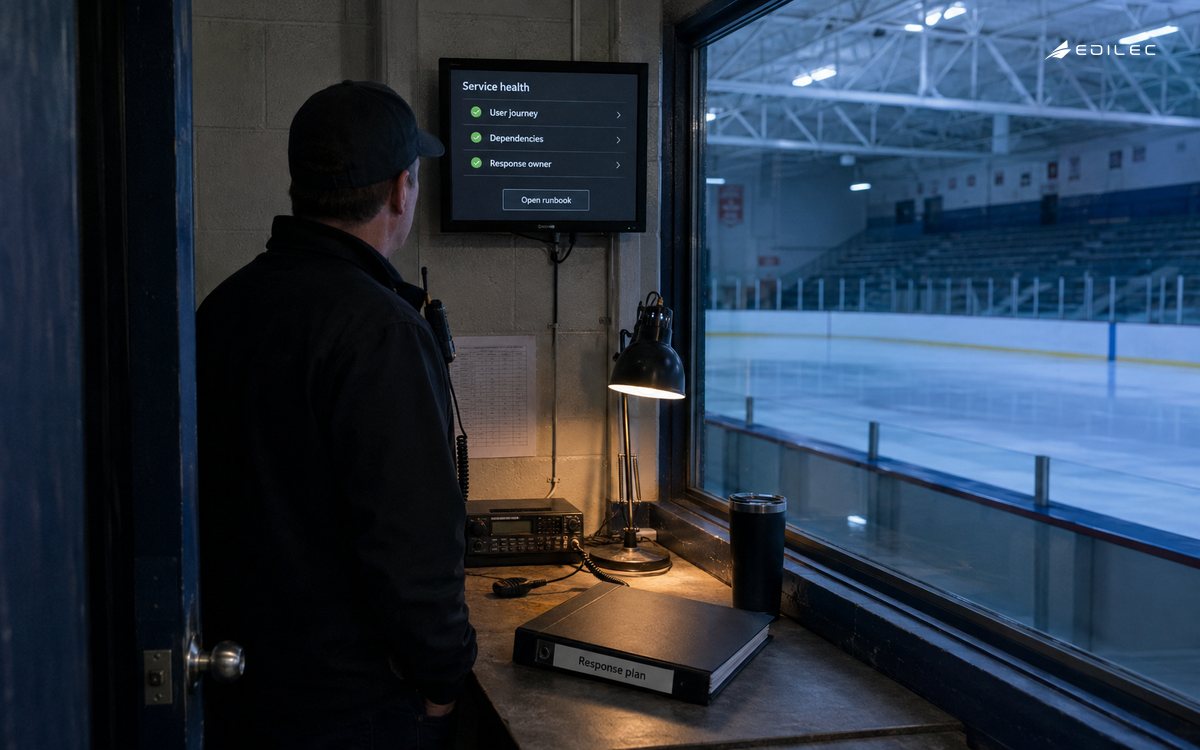
Logs should answer what happened, traces should show how work moved, and metrics should support efficient trends and alerts. They overlap but are not substitutes. Record identifiers that permit correlation without exposing business payloads. Version custom schemas, test instrumentation in CI, and make telemetry quality visible. Missing spans, duplicate metrics, clock skew and malformed labels are production defects because responders may make decisions from them.
Engineer the telemetry pipeline
Define agent and gateway placement, protocols, authentication, buffering, retry, transformation, sampling, routing and export. The OpenTelemetry Collector provides vendor-neutral receive, process and export components, but the team still owns configuration, capacity and security. Model peak event rates and downstream outages. Decide what happens when buffers fill: blocking the application, dropping low-value telemetry and losing critical audit events have very different consequences.
Separate production and non-production access. Encrypt transport, rotate exporter credentials, restrict query rights and audit administrative actions. Redact as close to the source as practical. Set retention by diagnostic, security, legal and cost needs, with tested deletion. Monitor collector health, queue depth, rejected points, export latency and backend limits from an independent path where possible; an invisible failure in the monitoring system creates false confidence.
| Signal | Best use | Cost risk | Quality check |
|---|---|---|---|
| Metrics | Trends, capacity and alerting | Cardinality explosion | Unit, labels and aggregation |
| Traces | Request paths and dependency latency | High sampling volume | Propagation and span completeness |
| Logs | Detailed events and forensic context | Verbose payload retention | Structure, timestamps and redaction |
| Profiles | Code-level resource diagnosis | Capture and storage overhead | Workload representativeness |
| Synthetic checks | Known external journeys | False coverage assumptions | Run from relevant locations |
Design alerts that lead to action
Page on sustained user-impact symptoms or imminent exhaustion that requires timely human action. Route lower-urgency defects to owned work queues. The Google SRE production practices state that something important enough to interrupt a human should require immediate action; otherwise it should be treated as a bug. Every alert needs an owner, severity, deduplication behavior, context link, first diagnostic steps, safe mitigation and escalation path.
Test alerts with injected failures and expired credentials, not just a manual test button. Verify receipt, grouping, routing, acknowledgement, escalation and resolution across working hours and handovers. Review pages after incidents and remove those that did not contribute to action, but do not optimize only for fewer notifications. Track missed detection and late detection as seriously as noise.
Build views for decisions, not decoration
Provide a service overview tied to objectives, a dependency view, deploy and change context, capacity trends and focused diagnostic views. Preserve time-zone, unit and filter clarity. Link from an alert to the relevant service, runbook and trace search with a bounded time window. Dashboards should reveal data freshness and partial coverage; a green panel based on absent data is dangerous. Retire duplicate and ownerless views after users confirm their decision path has moved.
Roll out with operational acceptance
- Approve the service boundary, user journeys, SLI definitions and ownership.
- Instrument one representative path and validate correlation from client to dependency.
- Load-test collection, sampling, retention and backend quotas at projected peaks.
- Exercise user-impact alerts, escalation, mitigation and telemetry-platform failure.
- Run the new setup beside the existing path and reconcile missed or conflicting evidence.
- Transfer runbooks, cost controls and review cadence to the permanent service team.
Acceptance should include a normal journey, slow dependency, partial regional failure, bad release, queue backlog, expired exporter credential and monitoring-backend outage. Ask an on-call engineer who did not build the setup to diagnose each scenario. Capture time to identify impact, isolate the dependency and choose a safe response. The result is operational evidence, not a screenshot of populated charts.
Review observability as a production service
Assign an owner and service objective to the observability pipeline itself. Define acceptable delay, loss and query availability for each signal class, plus what teams do when those objectives are missed. Critical security events, customer-journey metrics and verbose debug logs may need different paths. Document dependencies on DNS, identity, networks, collectors and vendor APIs so responders do not discover circular monitoring during an outage.
Perform a cardinality and privacy review before broad instrumentation. Sample actual attribute values, not just schema names. Customer IDs, URLs, SQL, headers, exception messages and baggage can contain sensitive or unbounded content. Establish allowlists, hashing or tokenization where appropriate, and reject unsafe dimensions at collection. Confirm that engineers can diagnose representative failures after redaction; privacy controls should be designed with operational evidence, not appended blindly.
Validate alert quality over a defined period. For every page, record the user symptom, decision, action, outcome and whether a less disruptive channel would have worked. Search incident records for failures that did not page, and compare synthetic, client and server evidence. Tune thresholds and burn-rate windows using observed behavior. A quiet on-call week is not proof when traffic, releases or failures were unrepresentative.
Exercise migration and vendor exit. Export dashboards, rules, SLI definitions and a bounded evidence set; route standards-based telemetry to an alternate destination; and estimate the labor to reconstruct investigations. Verify ownership of saved queries and runbooks. Portability does not require identical features, but the service must preserve detection and response while a backend is changed or unavailable.
Finally, inspect developer experience. Measure time to instrument a new service, discover semantic guidance, validate local output and obtain production access. Provide reviewed libraries and examples while allowing justified exceptions. If instrumentation requires specialist intervention for every release, coverage will decay. Treat usability, documentation and feedback as controls that keep telemetry trustworthy over time.
Establish a quarterly evidence review with service owners. Compare new dependencies, instrumentation versions, alert exceptions, retention changes and actual investigations with the approved design. Sample one dashboard claim back to raw evidence and one incident forward from symptom to corrective work. Retire unused attributes, alerts and views only after checking security and audit needs. This cadence keeps the setup aligned as architecture and teams change, and prevents an initially coherent platform from becoming another collection of opaque local conventions.
- Own the telemetry pipeline as a service.
- Inspect real attribute values for risk.
- Study pages and missed incidents together.
- Test alternate export and backend paths.
- Measure instrumentation usability.
Key takeaways
- Start observability and monitoring setup with user journeys and owned decisions.
- Use consistent signal semantics and test telemetry as production data.
- Protect, budget and monitor the collection pipeline itself.
- Page only when a human must act, while tracking missed detection.
- Accept the system through realistic diagnosis and recovery exercises.
Frequently asked questions
Do we need one observability tool?
No. A coherent operating path matters more than a single vendor. Standardized instrumentation and controlled routing can support multiple backends. Minimize duplicate stores and interfaces where they add cost or confusion, but preserve required security, audit and specialist capabilities.
Can we sample traces in production?
Yes, with a documented strategy and validation. Preserve rare errors and important transactions, understand head-versus-tail sampling behavior, and monitor what is dropped. Sampling should not make SLI calculations or investigations systematically misleading.
How long should logs be retained?
There is no universal period. Set retention by diagnostic value, incident response, legal duties, privacy, security and cost. Separate signal classes, minimize sensitive content and test deletion and archive retrieval instead of choosing a round number by habit.
Conclusion
A dependable observability and monitoring setup gives operators a tested path from user impact to evidence and action. Define the service first, instrument only useful context, engineer the telemetry pipeline, design actionable alerts and rehearse failure. That foundation produces faster diagnosis without turning unrestricted telemetry collection into a new operational, privacy or cost problem.