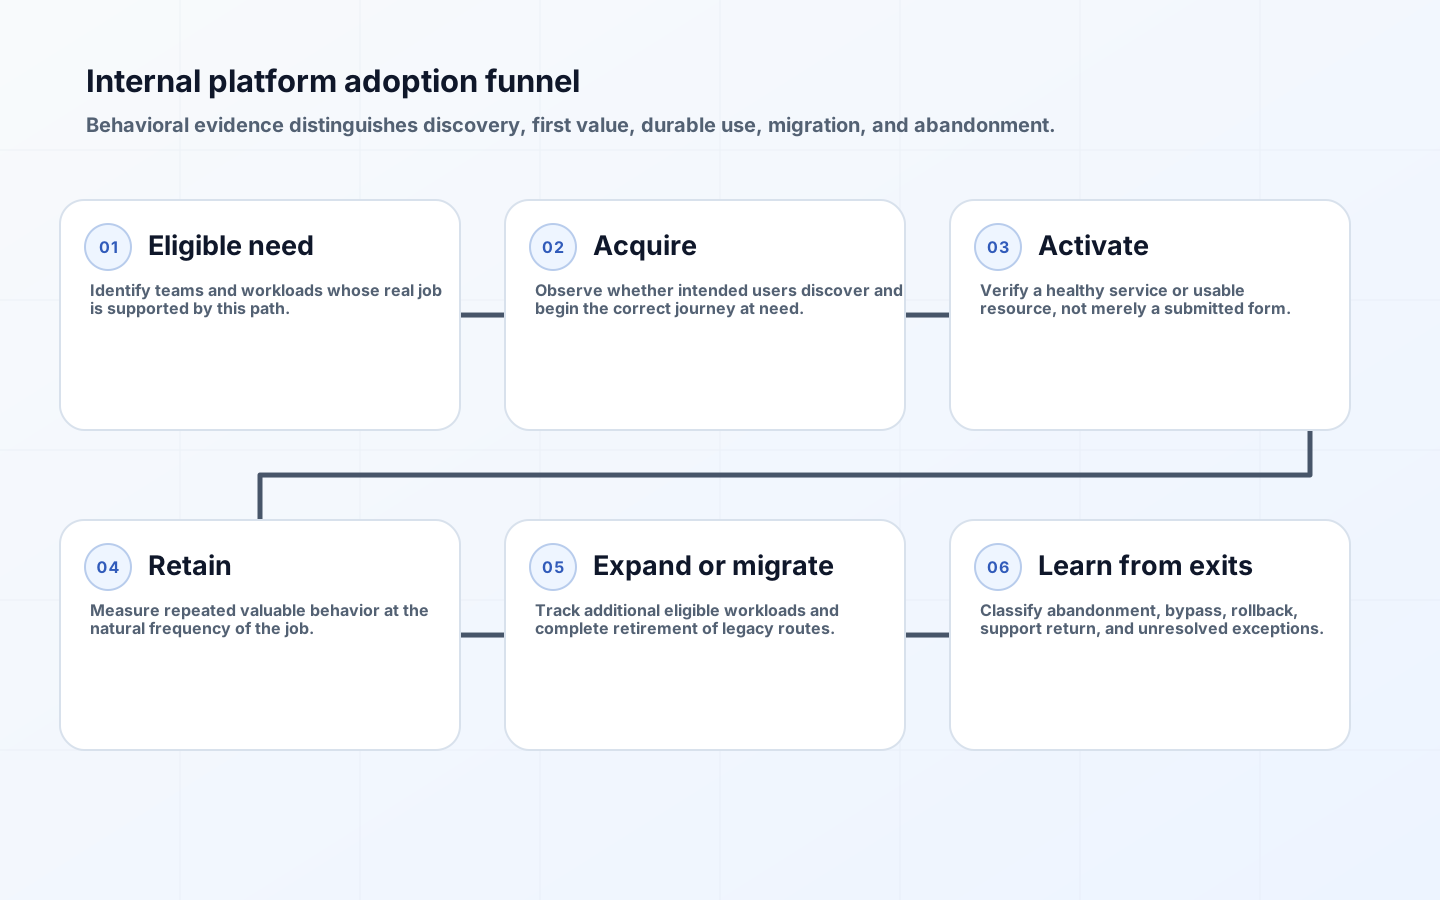
A platform team can close hundreds of tickets while developers continue provisioning infrastructure through copied scripts. It can register every repository in a portal while nobody completes the main self-service workflow twice. Output measures show effort; they do not show behavior change. Useful platform engineering adoption metrics follow teams from a relevant need through discovery, first success, repeated use, migration of meaningful workloads, and continued reliance on the supported path.
The funnel is not a sales metaphor pasted onto engineers. It is a way to locate friction in an internal product. The CNCF platform paper frames platforms as integrated capabilities presented around user needs and emphasizes research and feedback. Current DORA guidance likewise treats platform engineering as a sociotechnical product discipline and recommends a balanced view including delivery performance, developer experience, adoption and retention, and task success. No single count can represent those outcomes.
Start with a bounded product outcome
Define the user, job, path, and expected outcome before instrumenting. For example: product teams deploying HTTP services should be able to create a compliant nonproduction service and reach a healthy endpoint without a platform ticket. This is measurable. 'Adopt the IDP' is not, because a portal may expose docs, catalog search, templates, deployments, and infrastructure requests with different audiences and value. Build one funnel per important journey and retain the ability to compare cohorts.
Set an eligible population. Exclude teams for whom the path is intentionally unsuitable, but record the reason and review it. Otherwise adoption can be raised by shrinking the denominator or forcing incompatible workloads onto the platform. Segment by workload type, lifecycle, business unit, regulatory constraint, and migration status rather than ranking teams. The purpose is to improve the product and investment decisions, not to grade developers.
| Stage | Behavioral event | Diagnostic question | Misleading proxy |
|---|---|---|---|
| Eligible | Team has a job the path supports | Is the addressable population understood? | All engineering teams |
| Acquired | User discovers and starts the correct journey | Can intended users find it at need? | Portal login |
| Activated | A valid outcome is reached | Does first use produce value? | Template submitted |
| Retained | Team repeats the journey in a meaningful window | Does the path remain useful? | Account remains registered |
| Expanded | More eligible workloads or capabilities move | Has trust widened? | Number of catalog entities |
| Abandoned | Team exits, bypasses, or reverts after use | What broke the value proposition? | Support ticket closed |
Define events for each funnel stage
Use server-side product events tied to stable team and journey identifiers: documentation opened from a relevant context, template selected, review reached, task started, task completed, generated repository passed checks, deployment became ready, and service remained healthy. Backstage treats each template execution as a task with its own ID, which is useful for tracing starts, failures, cancellation, and retry. Join that task to the resulting component and deployment without collecting unnecessary personal activity.
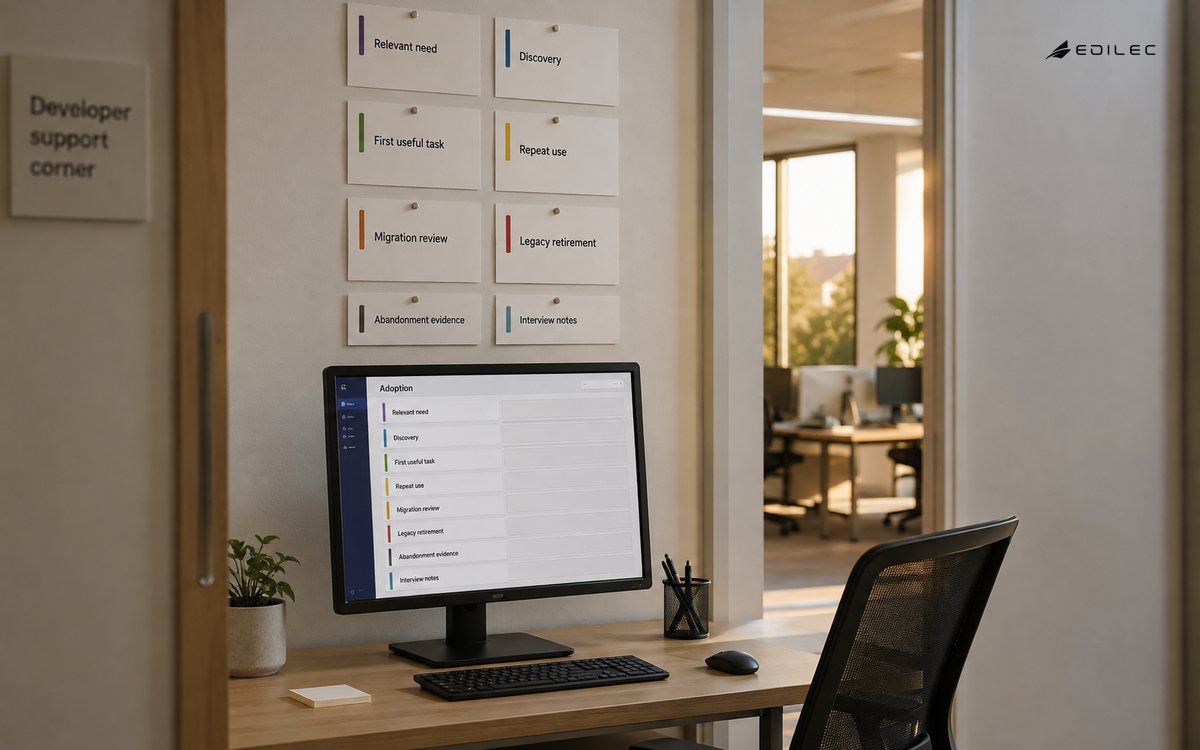
Activation must represent delivered value, not a button click. For a database request it may be a ready instance plus a successful authenticated connection from the workload. For a golden path it may be a generated service deployed and observable. Set a time window and classify failure, cancellation, and timeout. Preserve reason codes that distinguish invalid input, policy denial, platform failure, external dependency, and user abandonment.
Measure retention, migration, and abandonment
Repeat use should match the job's natural frequency. A team may create services quarterly but deploy daily; measuring weekly template retention would falsely show failure. Choose recurring behaviors that express continuing value, such as subsequent deployments through the path, supported upgrades accepted, additional eligible services onboarded, or self-service operations completed without intervention. Report cohort curves from first activation rather than mixing mature and newly onboarded teams.
Migration deserves its own state machine: discovered, assessed, eligible, planned, change offered, validation passed, cut over, observed, legacy route retired. A workload is not migrated because its catalog entry exists. Capture partial adoption and dual-running periods. Also instrument abandonment: users who begin then stop, activated teams returning to tickets, persistent bypasses, rollback to legacy tooling, or requests for broad exceptions. Interview a sample because telemetry describes the sequence, not the reason.
Pair conversion with task quality
High conversion can coexist with a poor mandatory platform. Measure task success rate, time to outcome, active work versus waiting, retries, error recovery, support handoffs, and clarity of feedback. DORA's current platform guidance highlights clear feedback on task outcomes as strongly associated with positive user experience. Instrument whether an error identifies the failed step and remediation, then ask users whether they could understand and recover without specialist help.
Use percentiles and distributions, not only averages. A smooth median can hide a long tail for regulated or legacy teams. Break time to outcome into discovery, input, approval, provisioning, deployment, and recovery. The bottleneck determines the intervention: documentation, defaults, policy design, capacity, integration reliability, or support. Track availability and correctness alongside speed so a faster workflow is not achieved by skipping controls or declaring success prematurely.
| Metric family | Example | Decision enabled | Guardrail |
|---|---|---|---|
| Reach | Eligible teams starting the path | Improve discovery or audience fit | Exclude irrelevant impressions |
| Activation | Healthy outcome within target window | Fix first-use journey | Verify runtime result, not UI completion |
| Retention | Cohort repeats valuable behavior | Prioritize reliability and continuing value | Use natural job frequency |
| Experience | Task success, recovery, and survey friction | Target specific interaction problems | Protect anonymity and context |
| Delivery outcome | Change lead time, deployment frequency, failed deployment recovery time, change fail percentage, rework | Test whether platform changes improve delivery | Measure at service or team level |
| Risk and cost | Policy exceptions, incidents, unit cost | Prevent adoption at unacceptable cost | Normalize by workload and demand |
Link adoption to delivery outcomes carefully
DORA's five software delivery performance metrics cover throughput and instability and are best measured for an application or service in context. Compare changes within a service before and after meaningful adoption, and use matched cohorts where practical. Do not claim causation from a dashboard correlation: staffing, architecture, product demand, and team maturity can influence both adoption and performance. Combine quantitative trends with rollout dates, interviews, and operational evidence.
Define a platform unit cost beside outcomes: cost per active workload, successful deployment, environment hour, or supported capability, with shared costs allocated transparently. Ticket volume can still diagnose friction, but interpret direction. Tickets may rise during successful onboarding, fall because self-service works, or fall because users abandoned the platform. Join ticket reason, funnel stage, cohort, and outcome before making a staffing or roadmap decision.
Govern measurement to prevent gaming and surveillance
Publish event definitions, owners, retention, access, known blind spots, and intended decisions. Collect the minimum identity needed for team-level cohorts, restrict raw event access, and aggregate survey results where respondents could be identified. Never use platform events or delivery metrics to rank individuals. Doing so changes behavior toward visible activity, discourages difficult work, and destroys the trust needed for candid feedback.
Review counter-metrics whenever a target is set. If activation is rewarded, check failed outcomes and immediate abandonment. If self-service percentage is targeted, check exceptions, risk, and user effort. If migration count matters, verify legacy retirement and production health. Allow teams to challenge eligibility and data quality. A measurement program is credible when it can say 'unknown' rather than manufacture precision from incomplete joins.
Run a recurring funnel review
- Confirm the journey, eligible population, and current cohort sizes.
- Inspect stage conversion, time, failures, and abandonment by relevant segment.
- Read task feedback and interview users at the largest unexplained drop-off.
- Choose one constraint and define the expected behavior change and guardrails.
- Ship the improvement to a bounded cohort and compare outcomes.
- Record what was learned, adjust event definitions, and retire metrics that no longer drive decisions.
Key takeaways
- Measure bounded user journeys, not generic portal adoption.
- Define activation as a verified outcome and retention at the job's natural frequency.
- Make migration and abandonment visible rather than counting registrations.
- Pair funnel conversion with task quality, delivery, reliability, risk, and unit cost.
- Use team-level improvement data and protect it from individual performance scoring.
Frequently asked questions
What is the best north-star metric for a platform?
There is no universal one. A useful top-level measure combines a verified valuable behavior for an eligible population with quality guardrails. Keep the component measures visible so teams can tell whether reach, success, retention, reliability, cost, or risk changed.
Should platform use be mandatory?
Some controls may be mandatory, but compelled use is not evidence of product value. Separate compliance coverage from voluntary preference, task success, and bypass behavior. Mandatory paths have an even stronger obligation to measure friction, accessibility, and exception quality.
Are support tickets an adoption metric?
No. They are diagnostic events. Interpret ticket reason and funnel stage with active population and outcomes. A rise can reflect onboarding growth; a fall can reflect better self-service or silent abandonment. Ticket counts alone cannot distinguish those cases.
Conclusion
A platform funnel makes internal product behavior observable from eligible need to durable use. It shows whether teams find a path, achieve a real outcome, return, migrate meaningful work, and remain successful. Balanced with experience, delivery, risk, and cost evidence, it gives platform leaders a practical way to improve the constraint that matters instead of celebrating output that users never adopt.