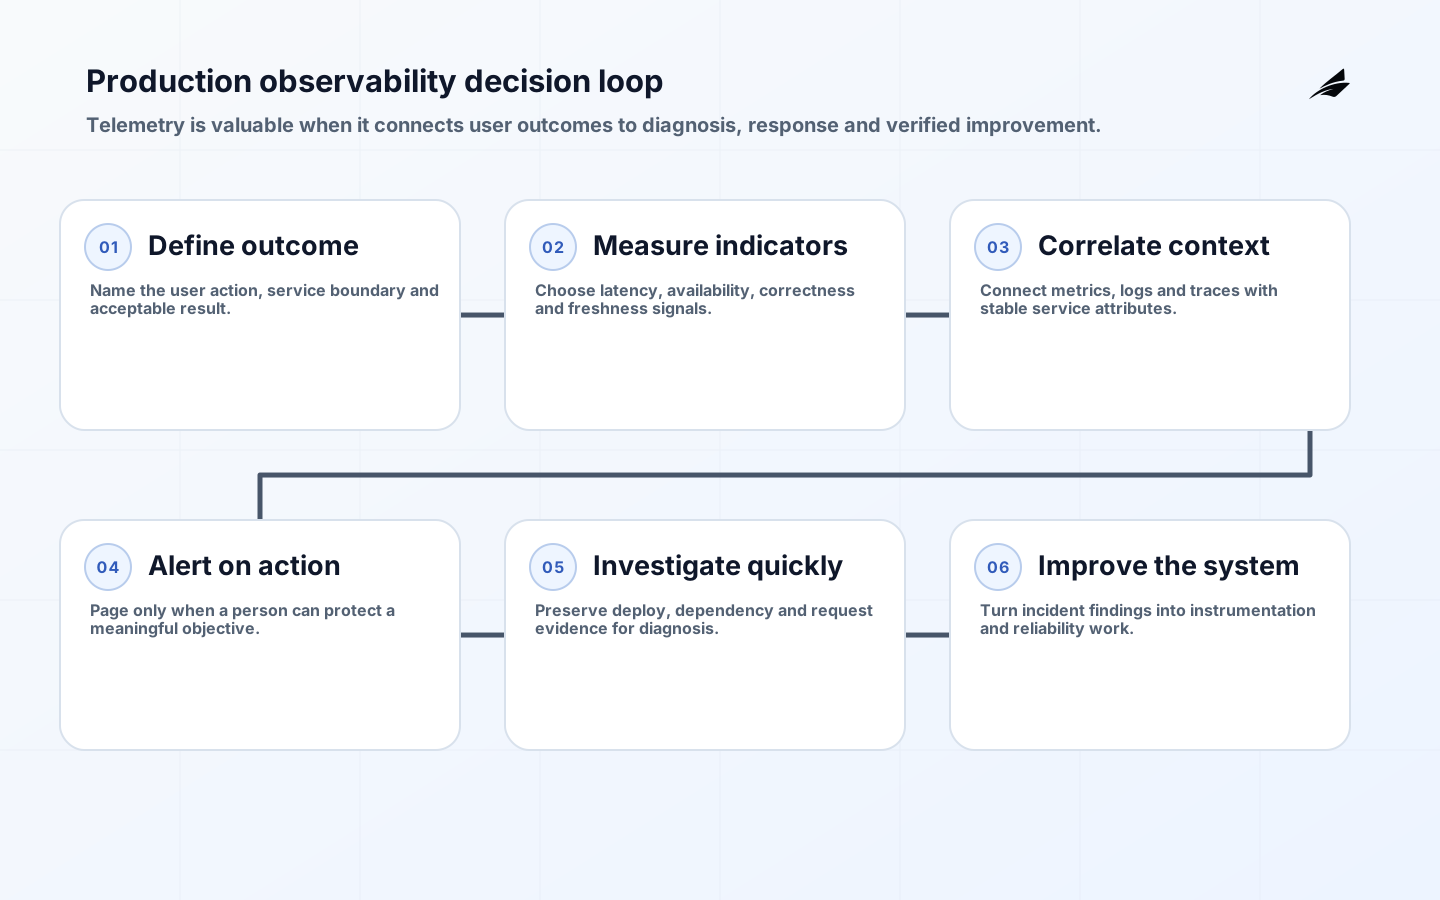
Observability and monitoring setup should begin with the decisions a production team must make, not with a shopping list of dashboards. Monitoring reports selected conditions; observability gives engineers enough evidence to ask new questions when a failure was not predicted in advance. In practice the two belong in one operating system: service objectives define what matters, telemetry describes behavior, alerts create accountable action, and incident review improves both the service and its instrumentation. A deployment that collects everything but cannot explain a failed customer journey is expensive instrumentation, not effective observability.
This FAQ explains how to design that operating system for web applications, APIs, data pipelines and cloud platforms. It uses the vendor-neutral signal model documented by OpenTelemetry and the service-oriented monitoring principles in Google SRE. The central test is practical: when a customer reports a slow or incorrect result, can the team identify the affected service, compare the event with a known objective, trace the request across dependencies, find the responsible change and verify recovery without guessing? The answer determines the setup, retention and ownership you actually need.
What should an observability and monitoring setup achieve?
Start with a small inventory of user-facing services and critical internal capabilities. For each service, document the owner, customers, entry points, dependencies, important data and failure consequences. Then define service-level indicators that represent user experience: successful request ratio, end-to-end latency, data freshness, queue completion or transaction correctness. Host CPU and memory still matter for diagnosis and capacity, but they rarely describe whether the user received the promised result. A healthy server can return the wrong account balance, stale inventory or an authorization failure.
Translate each indicator into an objective and an operating response. State the measurement source, valid population, exclusions, evaluation window and decision that follows a breach. A monthly percentage without those details invites disagreement during an incident. Add a small set of diagnostic questions: what changed, which tenants or regions are affected, where time is spent, which dependency failed and whether recovery is working. Instrumentation should make those questions answerable. If a signal has no consumer, decision or retention reason, challenge its cost before collecting it at scale.
| Layer | Primary question | Useful evidence |
|---|---|---|
| User outcome | Did the customer complete the intended action? | Success ratio, end-to-end latency, correctness |
| Service | Which boundary is failing? | Request rate, errors, saturation, dependency health |
| Change | What became different? | Deploy markers, feature flags, configuration history |
| Resource | What physical constraint contributes? | CPU, memory, storage, network and queue depth |
How should metrics, logs and traces work together?
Metrics summarize behavior across time and are efficient for objectives, trends and alert evaluation. Logs record discrete events and detailed context. Traces show the path and timing of a request through services. OpenTelemetry treats these as distinct signals that become more useful when they share resource attributes and trace context. Use a stable service name, environment, version, region and deployment identifier across signals. Add tenant or account context only where privacy, cardinality and access controls permit it; raw user identifiers should not become unrestricted telemetry labels.
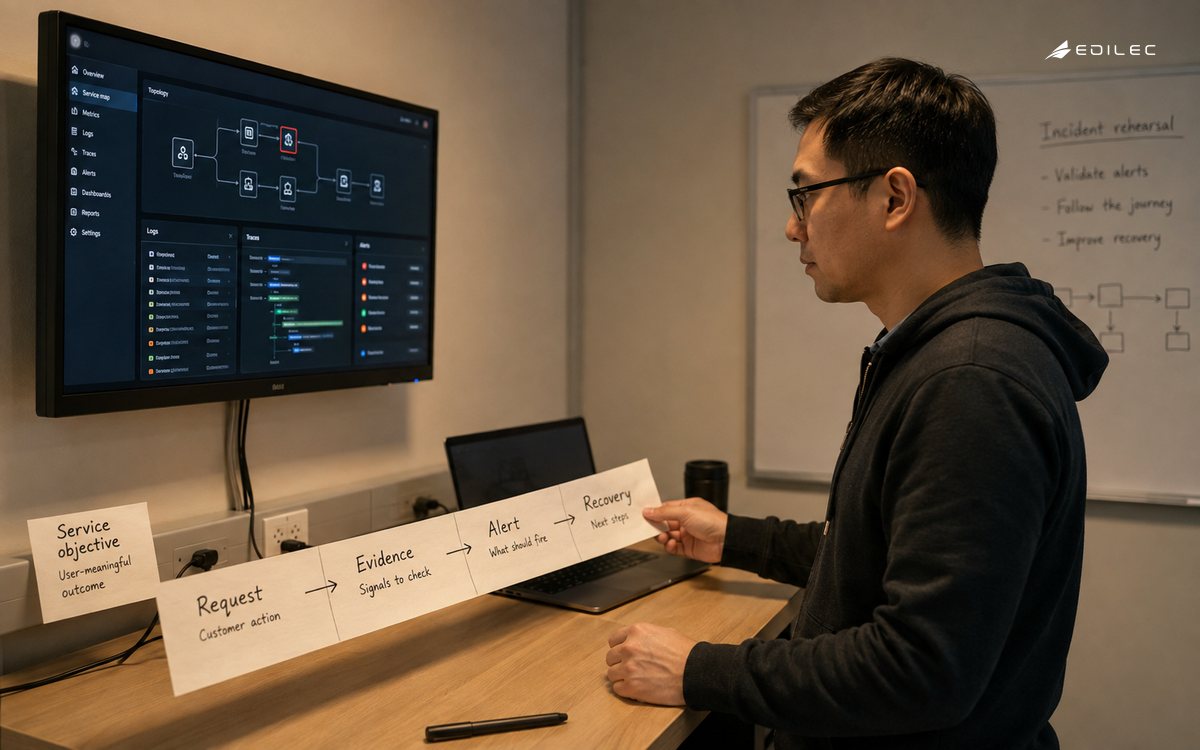
Instrumentation should combine automatic coverage with deliberate application events. Auto-instrumentation can reveal HTTP, database and messaging spans quickly, but it cannot know whether a payment, approval or data publication was correct. Add domain-level measurements at the points where the system accepts work, changes durable state and produces an outcome. Propagate context across queues and scheduled jobs, not only synchronous HTTP calls. Record errors once at the boundary that can explain them, and preserve the causal link rather than duplicating the same stack trace in every layer.
What makes an alert actionable instead of noisy?
An alert should represent a meaningful risk to a service objective and reach a person who has authority, tools and a documented first response. Page for urgent conditions that require immediate action; create tickets for bounded work that can wait; use dashboards for exploration. Alerting on every resource threshold creates fatigue and masks customer impact. Prefer multi-window burn-rate or sustained-condition logic where appropriate, and include the affected service, observed value, objective, recent changes, dashboard and runbook in the notification.
Test alerts as production code. Simulate the condition, verify routing at every hour, confirm that deduplication works and ensure recovery closes the event. Track pages per on-call shift, false-positive rate, time to acknowledgement and alerts without a useful action. Delete or redesign alerts that repeatedly produce no decision. During an incident, allow responders to add temporary diagnostics without permanently increasing telemetry volume. Afterward, decide whether the new signal belongs in standard instrumentation and whether the alert detected the problem at the right layer.
| Alert class | Delivery | Acceptance test |
|---|---|---|
| Immediate service risk | Page the accountable on-call | Responder can identify impact and begin mitigation |
| Important nonurgent defect | Owned work queue | Due date and service owner are visible |
| Capacity trend | Planning review | Forecast leads to a scaling or demand decision |
| Informational change | Dashboard or event stream | Useful for correlation, never wakes a responder |
How do teams control telemetry cost and cardinality?
Telemetry cost grows through event volume, attribute cardinality, retention, indexing and query patterns. Establish budgets per service and signal, then measure ingestion and storage by owner. High-cardinality attributes such as user IDs, unbounded URLs and random request values can create large metric series and expose sensitive data. Keep metrics labels bounded, place detailed identifiers in controlled logs or traces, and use sampling deliberately. Head sampling is predictable but can miss rare failures; tail sampling can retain slow or erroneous traces but requires collector capacity and clear rules.
Retention should follow operational and assurance needs. Recent high-resolution data supports incident response; older aggregates may be sufficient for capacity and reliability trends. Security and audit records may need different controls from application debug logs. Apply redaction before export, encrypt telemetry, restrict production access and audit sensitive queries. Cost optimization is not simply deleting data: verify that responders can still diagnose representative failures and that objective calculations remain correct. A quarterly telemetry review should remove unused fields, tune sampling and assign each expensive data stream an explicit purpose.
How should an observability rollout be sequenced?
Choose one important service and one real customer journey. Baseline its current incident and support experience, define two or three indicators, add deployment markers and instrument the request path. Build a dashboard around the objective and diagnostic questions, then rehearse a latency increase, dependency failure and bad release. Capture which evidence was missing and fix that before expanding. This thin vertical slice proves the collection pipeline, naming conventions, access model, alert route and runbook together; deploying collectors everywhere first postpones the hardest design decisions.
Scale through reusable conventions rather than copied dashboards. Publish semantic attributes, instrumentation libraries, collector configuration, dashboard components and alert templates as versioned platform products. Let service teams add domain signals while a central group owns transport, policy and cost guardrails. Define onboarding acceptance: telemetry appears with correct ownership, sensitive fields are absent, alerts reach the right rotation, runbooks work and a synthetic or controlled fault is visible end to end. Review coverage after architecture changes because a new queue or provider can break context propagation silently.
Document the operating model beside the instrumentation. Service owners should know how to request a new signal, who approves sensitive attributes, which team maintains collectors, how backend outages are detected and how telemetry configuration is released. Establish a degraded mode so an observability-platform incident does not automatically become an application outage or hide all production state. Export and recovery procedures should preserve the minimum evidence needed for response. Periodically sample dashboards, alerts and traces against live architecture; stale service names, departed owners and retired dependencies are signs that the setup is no longer trustworthy.
Include support and product teams in that review. Support cases reveal symptoms that dashboards miss, while product teams can identify journeys whose success semantics changed. Compare incident timelines with telemetry timestamps and verify clock synchronization. Review instrumentation during service retirement so obsolete collectors, alerts and data permissions are removed. These maintenance habits prevent an initially strong setup from becoming a costly archive of signals that no longer represent the production system.
Key takeaways
- Define observability around user outcomes and operating decisions.
- Correlate metrics, logs and traces with stable, privacy-aware context.
- Page only for material conditions with an owner and tested response.
- Budget cardinality, retention and access as part of the design.
- Prove the setup with fault exercises before broad rollout.
Frequently asked questions
Do we need traces for every request?
No. Full tracing may be justified for low-volume critical flows, while high-volume services often use representative or tail-based sampling. Preserve all traces for important errors when feasible, document sampling effects and ensure objective metrics are not calculated from a biased trace sample.
Should logs be stored in the same platform as metrics?
Not necessarily. A shared interface can improve investigation, but retention, cost and access requirements differ. The important property is reliable correlation through time, service identity, deployment and trace context, with documented links between tools.
What is the minimum useful dashboard?
Show the service objective, current user impact, request volume, error and latency distribution, saturation, dependency health and recent changes. Every panel should answer a defined operating question; a wall of infrastructure graphs is not a substitute for a service view.
Conclusion
A professional observability and monitoring setup is a maintained production capability. It connects a service promise to evidence, assigns action, controls telemetry risk and improves after incidents. Start with one service and prove that a real symptom can be diagnosed and mitigated. Expand only after the naming, ownership, privacy, cost and response model work together. That approach produces fewer decorative dashboards and a much shorter path from customer impact to reliable recovery.