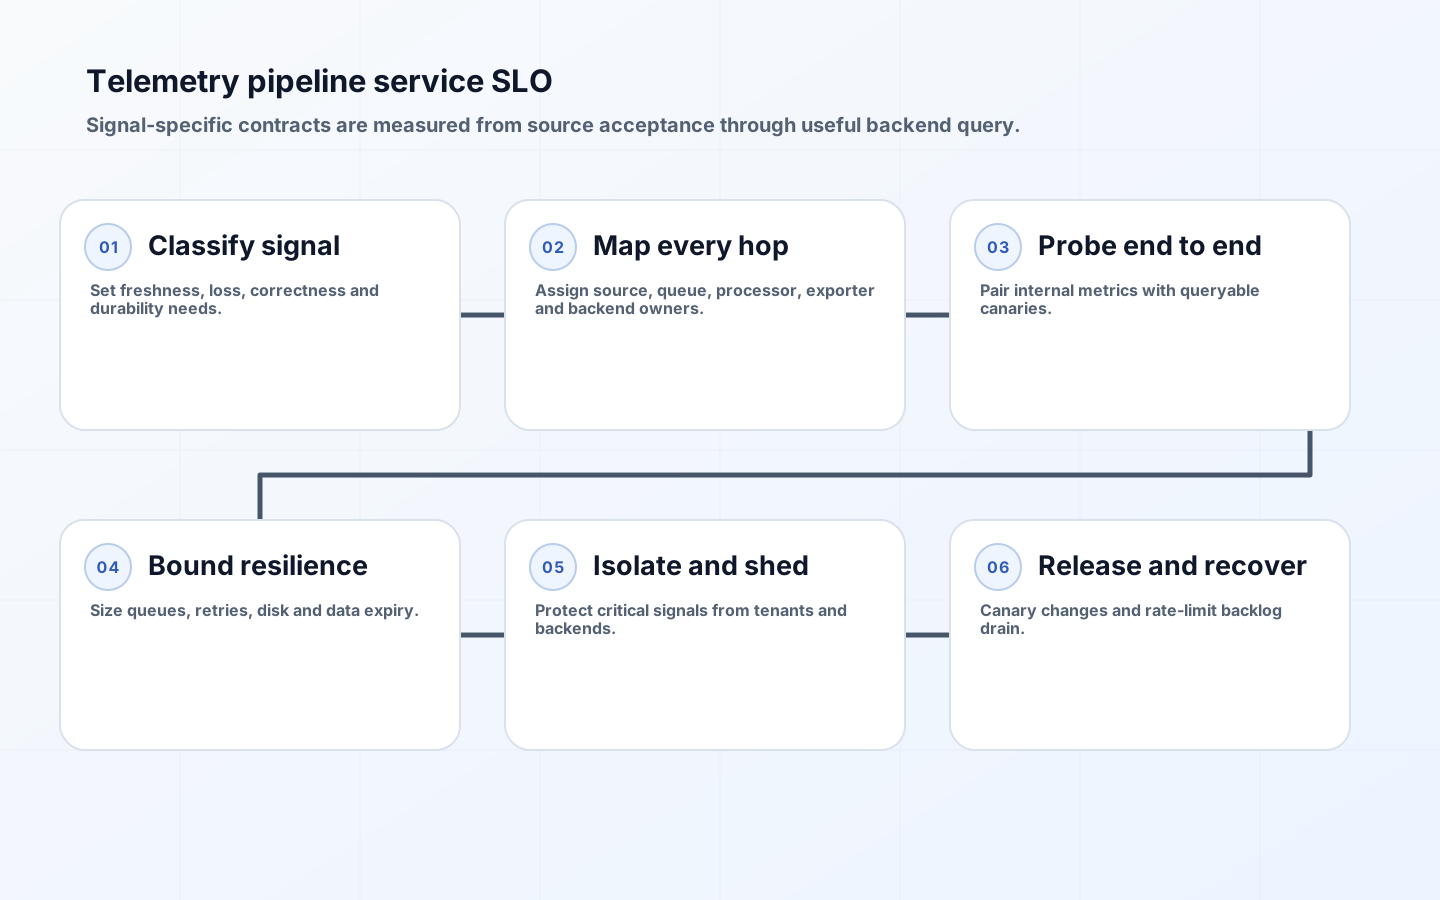
Telemetry pipeline reliability matters most when applications are already failing. A shared pipeline that silently drops spans, delays logs, corrupts metric identity, or blocks during backend throttling can leave responders blind and make healthy services look broken. Once many teams depend on agents, gateways, processors, routing, and backends, that chain is a production service with customers, capacity limits, change risk, and recovery obligations.
An uptime check on the Collector port is not enough. The pipeline contract concerns accepted data, valid transformation, delivery within useful time, and known loss. Different signals need different guarantees. A delayed trace may still help a post-incident investigation; a delayed alerting metric may be useless. A log required for audit may need durable handling that best-effort debug spans do not.
Map the end-to-end data path and ownership
Draw every hop from SDK, file or scraper through agent, gateway, processor, exporter, network, backend ingest, storage, and query. Mark protocol, authentication, batching, queue, retry, persistent storage, load balancer, routing key, and transformation. Identify which team owns each boundary and how it proves handoff. A count accepted by a receiver is not proof that the backend indexed it.
Create service classes by signal, tenant, and purpose. Critical alert metrics, security audit logs, diagnostic traces, and development telemetry may share technology but not reliability objectives. Document maximum useful delay, acceptable loss, retention outside the pipeline, privacy controls, and backpressure behavior. Avoid promising zero loss without end-to-end durable acknowledgement and tested failure semantics.
| Service class | Primary reliability need | Useful SLI | Likely design |
|---|---|---|---|
| Alerting metrics | Fresh and continuous delivery | Canary points queryable within delay bound | Isolated path, minimal processing, strong capacity reserve |
| Diagnostic traces | Representative and complete selected traces | Expected spans or canaries delivered by policy | Sampling-aware count and bounded queue |
| Audit logs | Durable, ordered enough, access controlled | Sequence or event reconciliation | Persistent buffer and explicit loss escalation |
| Debug logs | Best-effort cost control | Accepted and delivered volume trend | Aggressive limits and shorter retention |
| Derived metrics | Correct aggregation and identity | Known-input result matches expected series | State-affine routing and single writer |
Define SLIs for acceptance, freshness, loss, and correctness
Use Collector internal telemetry to observe receiver accepted and refused items, processor incoming and outgoing items, exporter queue size and capacity, enqueue failures, in-flight requests, send failures, and sent items. Interpret counters in context: a send failure may be retried and does not prove loss; an enqueue failure after a full queue is stronger evidence that data did not enter the retry path. Segment by signal, pipeline, exporter, and bounded tenant class.
Add end-to-end canaries. Periodically emit a uniquely identifiable but non-sensitive metric point, log event, and trace through each critical route, then query the backend and measure delay and content. Canary success detects failures beyond the last Collector, including backend indexing and query. Keep the canary producer and monitor independent enough that one pipeline fault does not hide both data and alarm.
Measure correctness where processors transform, aggregate, sample, or route. Compare known input with expected output for redaction, attribute mapping, tail policy, and metric conversion. Track incomplete traces, overflow, duplicate or out-of-order metrics, and route failures. A pipeline can deliver every byte and still violate its service contract by changing signal meaning.
Set objectives from investigation and alerting needs
Define objectives per service class: proportion of canaries queryable within two minutes, proportion of eligible data refused at ingress, known loss after queue expiry, maximum sustained queue utilization, or correctness pass rate for transformations. Choose windows that expose both fast incidents and chronic degradation. Pair percentages with volume because one percent loss during a traffic surge may erase the rare failures an investigator needs.
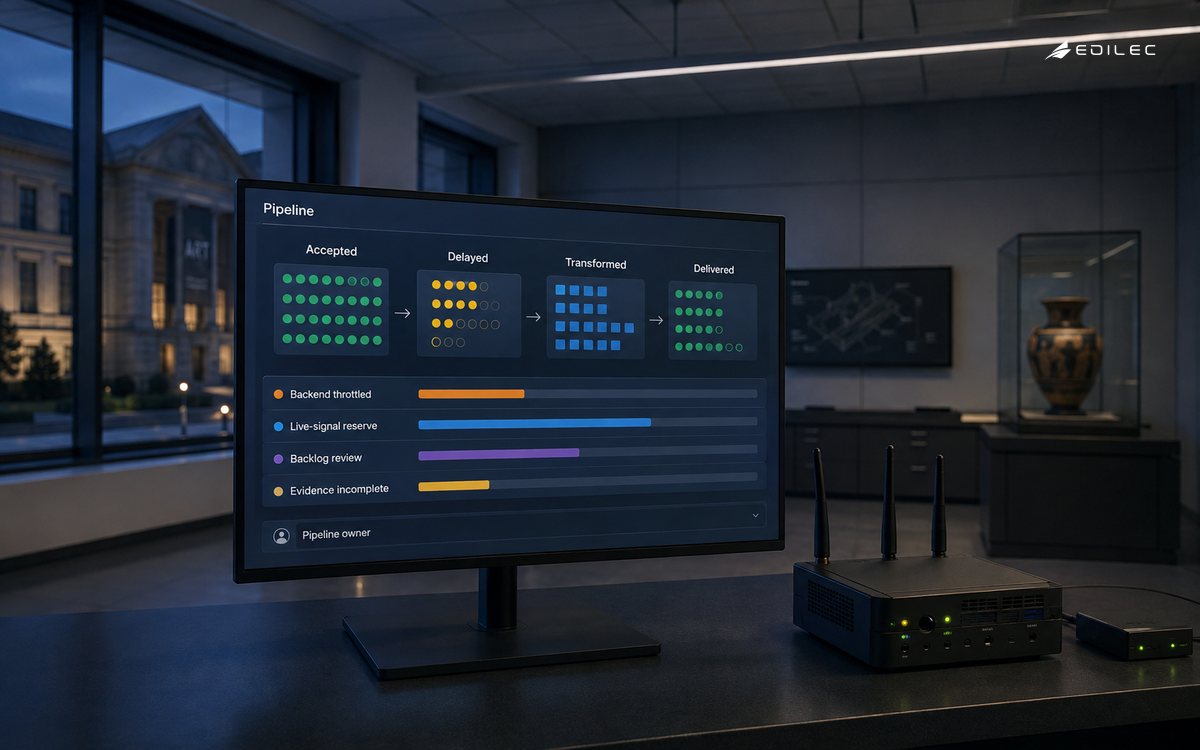
Write an error budget policy for the telemetry service. High burn on alert metrics may freeze risky pipeline releases, reduce optional processing, isolate a noisy tenant, or activate a direct emergency route. Diagnostic-trace loss may trigger sampling changes or capacity work. The policy must not encourage indiscriminate acceptance that overloads the backend; controlled documented shedding can be healthier than total collapse.
| SLI | Calculation or probe | What it reveals | Important limitation |
|---|---|---|---|
| Ingress refusal | Refused divided by accepted plus refused | Clients cannot enter pipeline | Client retries may hide eventual loss |
| Queue pressure | Queue size divided by capacity plus oldest age | Buffer headroom and outage tolerance | Size in batches may hide byte variation |
| Export failure | Failed sends and in-flight requests over time | Backend or network trouble | Retries mean failure is not automatically loss |
| End-to-end freshness | Backend query time minus canary event time | Complete path usability | Canary may not represent every tenant |
| Transformation correctness | Known input compared with queried output | Semantic integrity | Covers configured test cases, not all payloads |
Engineer queues and retries with bounded resilience
Enable sending queues and retry behavior for transient exporter failures, then size them from arrival rate, item or batch size, outage duration, and available resources. In-memory queues absorb brief failures but vanish with the process. Persistent queues using supported storage can survive restart, but disk is finite and storage failure remains possible. Encrypt and restrict buffered sensitive telemetry as required.
Define retry maximums, backoff, and the oldest useful data. Retrying forever can fill storage and delay fresh high-value signals behind stale debug data. Isolate exporters and service classes so one throttled backend does not block every destination. Decide overflow order and emit a durable operational event when loss occurs. The pipeline should make loss visible without logging each dropped record and causing another volume incident.
Control backpressure and intentional shedding
Use memory limiting early in each Collector pipeline and set process memory against container limits. When processors or exporters cannot keep up, bound queues and let receivers refuse data rather than allowing an out-of-memory restart loop. Understand SDK behavior: some clients retry, some drop, and some can block application threads. Telemetry must not be allowed to take down the instrumented service.
Create a shedding order. Drop verbose development logs, low-value attributes, or low-priority traces before alert metrics and required audit events. Apply tenant and signal quotas to contain noisy producers. Sampling and filtering are normal cost controls only when policy is explicit; emergency shedding should be separately observable and time-limited. Preserve a minimal health channel outside complex processing.
Isolate failure domains and scale by component behavior
Partition gateways by region, environment, tenant risk, or signal where the blast-radius reduction justifies cost. Stateless pipelines can scale behind ordinary load balancing. Scrapers need one owner per target. Stateful processors such as tail sampling or cumulative-to-delta conversion need data-affine routing and careful rollout. Scaling replicas without honoring state can improve process availability while reducing telemetry correctness.
Capacity-plan normal, release, incident, and backend-outage conditions. Incidents often increase error traces and logs while a tail policy retains more data. Reserve headroom and test this correlated surge. Autoscale on useful leading indicators such as CPU, memory, queue pressure, or incoming rate, but remember that scaling delay and state remapping can matter. Maintain quotas and pre-provisioned minimums for critical routes.
Release, rollback, and recover without losing the investigation
Version Collector distribution, component set, configuration, semantic rules, and dashboards together. Validate configuration, replay representative fixtures, canary one failure domain, and compare data volume and shape before broad rollout. Check component stability levels and release notes. A syntactically valid configuration can still multiply series, remove attributes needed for routing, or change sampling coverage.
Run failure drills: stop a Collector, fill a queue, throttle a backend, expire credentials, lose local disk, send an oversized batch, and roll back a processor. Verify canaries, alarms, queue drain, duplicate handling, and stateful-data behavior. During recovery, rate-limit backlog so old telemetry does not starve live signals or overwhelm backend ingest. Record the interval for which evidence is incomplete.
Build runbooks around symptoms and safe reductions
Create runbooks for receiver refusals, rising queue age, enqueue failure, exporter failure, memory pressure, disk exhaustion, backend throttling, canary delay, missing signal classes, and transformation defects. For each, provide verification queries, likely boundaries, reversible mitigations, data-loss assessment, communication, and escalation. Operators should know which processing can be disabled and which controls must never be bypassed.
Publish service status and planned changes to instrumentation teams. Provide quotas, SDK guidance, ownership, and a route for onboarding new volume. After incidents, reconcile available counters and canaries to estimate loss as a range, disclose uncertainty, and preserve affected windows for investigators. Improve the weakest handoff rather than assigning every failure to the central Collector team.
Key takeaways
- Define service classes and map every telemetry handoff from source to query.
- Combine Collector internal metrics with independent end-to-end canaries and correctness tests.
- Set SLOs by freshness, known loss, pressure, and semantic integrity rather than process uptime.
- Bound queues and retries, isolate noisy signals, and specify emergency shedding order.
- Canary configuration and rehearse backend outage, state loss, rollback, and backlog recovery.
Frequently asked questions
Can an OpenTelemetry pipeline guarantee zero loss?
Not merely by enabling queues. End-to-end zero loss requires durable acknowledgement, sufficient storage, recoverable state, and a contract through backend indexing. Most pipelines should state bounded best-effort or class-specific durability and make known loss observable.
Does an exporter send failure mean telemetry was lost?
Not necessarily. The exporter may retry from its queue. Enqueue failure, retry expiry, queue overflow, process loss with only memory buffering, or end-to-end canary absence gives stronger loss evidence. Correlate counters over the same interval.
Should the pipeline monitor itself?
Yes, but use an independent minimal path for critical Collector health and canary alerts. If all internal telemetry traverses the same failing processors and backend, the monitoring failure can hide itself.
Conclusion
A telemetry pipeline earns trust through visible delivery and known boundaries. Map the chain, define signal-specific SLOs, probe it end to end, and design bounded behavior for saturation and outage. When queues, stateful routing, changes, and recovery are operated with the same care as customer services, observability remains useful precisely when the rest of the system is least healthy.