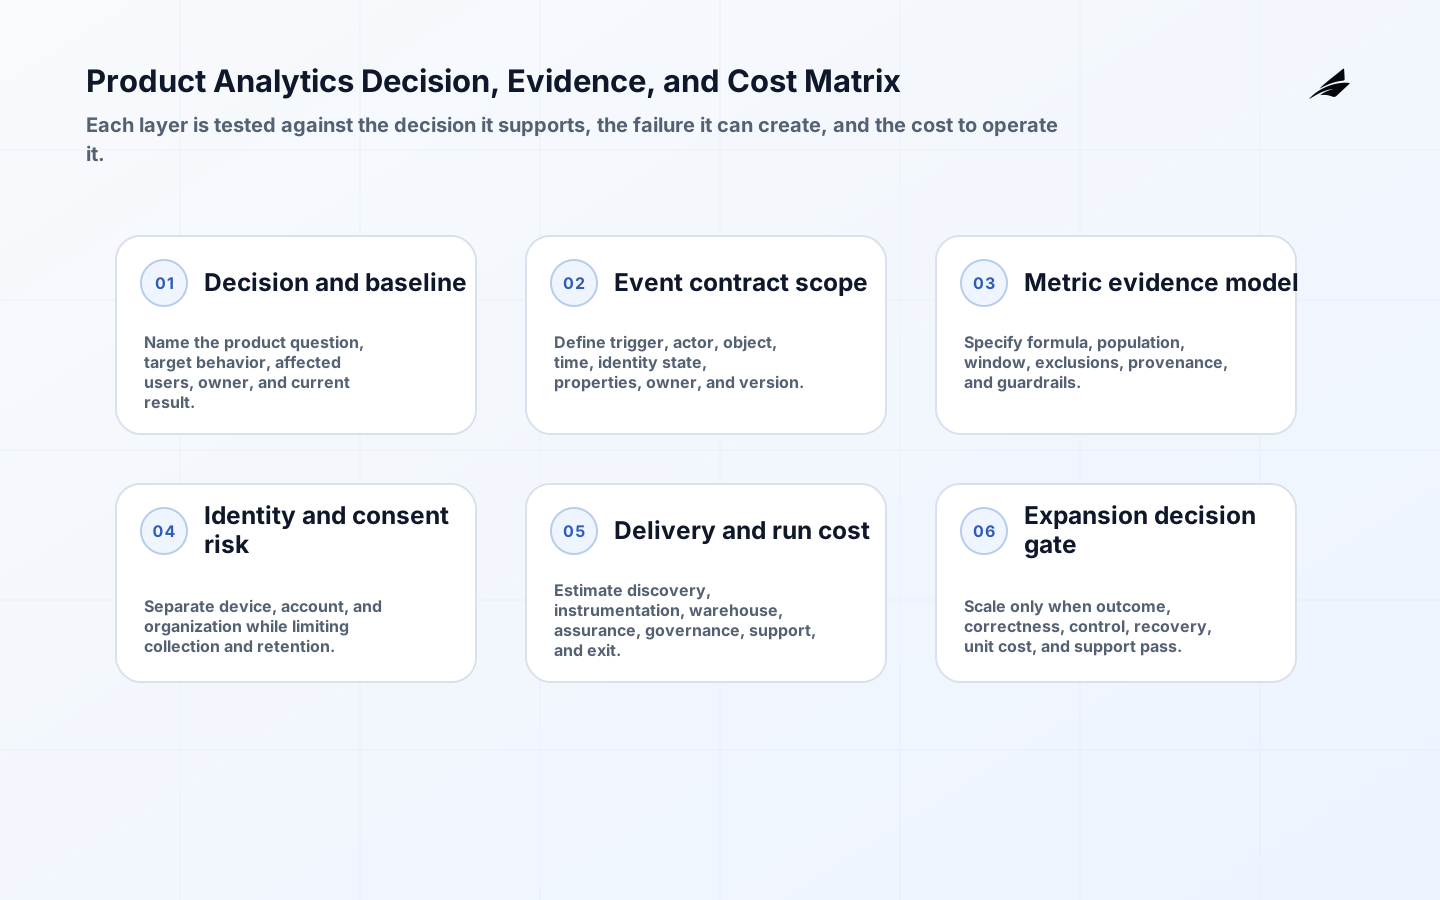
Product Analytics is valuable only when it improves a named operating outcome and leaves behind a service that people can govern. The practical unit of scope is the product decision supported by a defined user behavior and metric. That framing exposes data, identity, integration, controls, people and provider dependencies that a tool list misses. It also makes trade-offs reviewable: leaders can decide what authority changes, what evidence proves readiness, what remains outside scope and what must happen when the new path fails.
Define the outcome and service boundary
Start with decisions and hypotheses, then define the minimum events and properties needed. Tracking every click produces volume without a clear interpretation. Scope should name the current baseline, target behavior, affected users, authoritative records and material failure consequences. It should also identify exclusions. A bounded first release can exercise the full path without pretending to solve every adjacent process. The accountability model is equally important: product owners define decisions and hypotheses; data owners govern metric logic; engineers own reliable instrumentation. Record that boundary in the service design and acceptance criteria, not only in a presentation.
Discovery should trace several real cases from start to finish, including delayed, disputed and high-risk examples. Interviewing leaders reveals policy; observing operators reveals how work actually completes. Inventory applications, data stores, identities, scheduled jobs, third parties, manual handoffs and calendar constraints. For each dependency, record an owner, expected behavior, failure signal and continuity method. This produces an evidence-backed scope and a list of unknowns that can be priced and retired. For product analytics, sample identity merges, event drift and experiment-quality failures explicitly.
| Scope question | Decision evidence | Acceptance signal |
|---|---|---|
| Outcome | Baseline, target and accountable owner | A measurable change tied to a real user or operation |
| Authority | Decision rights and system-of-record boundaries | No critical state or approval has two owners |
| Failure | Impact, fallback and recovery objective | Teams can complete or safely pause the workflow |
| Change | In-scope population, exclusions and rollback | The first release is bounded and reversible |
Design the operating architecture
Create an event contract with semantic name, trigger, actor, object, timestamp, identity state, property definitions, owner and version. Test it like any other interface. Architecture is not only a component diagram. It is a set of contracts about state, authority, access, timing and failure. Define inputs and outputs, versions, retry behavior, reconciliation, audit events and the point at which responsibility changes hands. Prefer managed or shared capabilities when their operating boundary is understood; keep custom logic where the business rule or control genuinely differentiates the service.
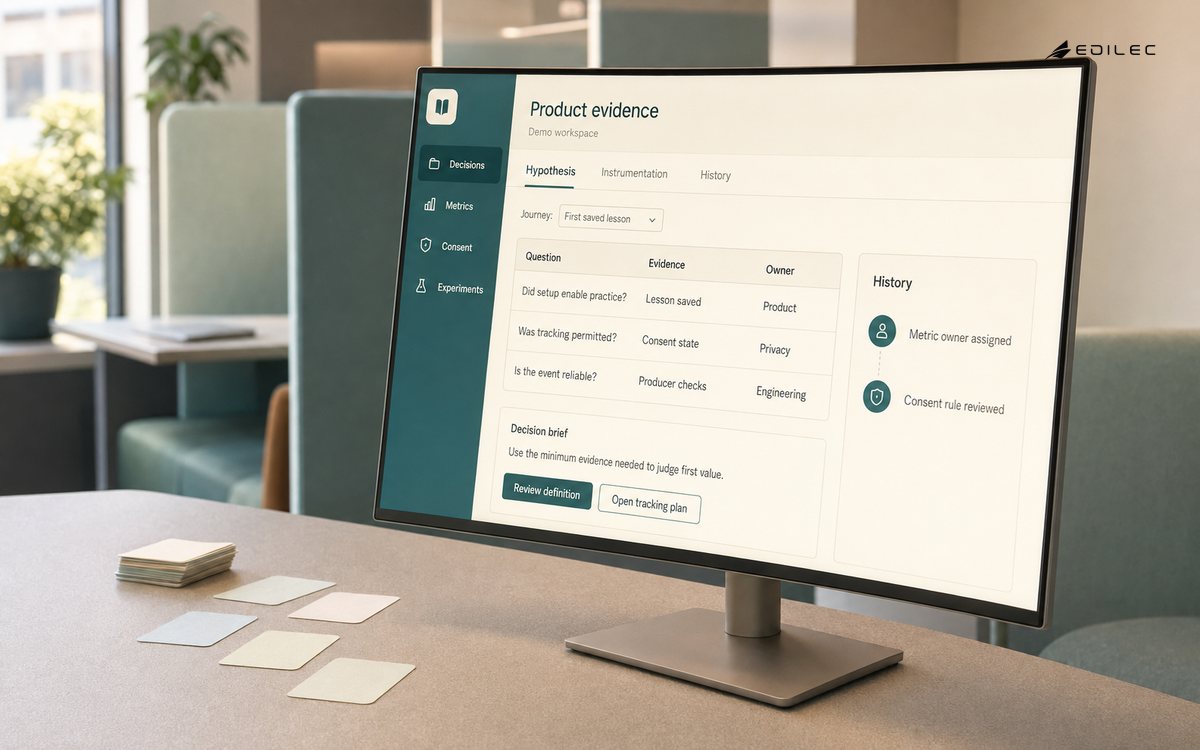
Separate anonymous devices, authenticated accounts and organizations explicitly. Identity stitching can create false journeys and privacy risk when merge rules are implicit. Security and privacy belong in those contracts. Separate human, service, privileged and emergency identities; minimize access; protect secrets; classify data; set retention; and test authorization at the action boundary. Logging must preserve enough provenance to investigate decisions without creating a new uncontrolled copy of sensitive content. Threat modeling should cover abuse, dependency compromise, configuration drift and recovery, then assign each treatment to an owner.
Build an evidence model, not a dashboard collection
Govern metrics as formulas with population, window, exclusions and source. Activation, retention and conversion need stable definitions before teams compare changes. Evidence should connect an observed condition to a decision. Define each measure with a formula, source, population, timing, owner and known limitation. Pair outcome measures with leading indicators such as exception age, failed controls, backlog, saturation or unsupported cases. Counts without denominators and averages without distributions can conceal concentration; use segmented results where user, workload or risk differences matter.
Keep provenance from source through transformation to report. Version definitions and disclose material changes. A control result should identify what was tested, when, against which configuration and by whom. An operational signal should route to someone able to act. Review unused dashboards and noisy checks as debt: evidence that does not change a decision still consumes attention and cost, and it may create false confidence during an incident. Here, preserve event contract, metric definition and analysis version.
Model cost across discovery, change and operation
No universal price or timeline is credible for a product analytics program. Estimate ranges from inspected evidence and separate one-time delivery, transition and recurring operation. Major cost drivers include research and measurement design; SDK and server-side instrumentation; warehouse, transformation and query; identity and consent engineering; experiment analysis and quality checks; and taxonomy governance and ongoing maintenance. Show volume, retention, availability, staffing, licensing and growth assumptions beside the numbers. Reforecast after discovery and the proof slice because uncertainty should decline as the team learns.
| Cost layer | What to estimate | Evidence to request |
|---|---|---|
| Discovery | research and measurement design; SDK and server-side instrumentation | Inventories, samples, interviews and dependency maps |
| Build | warehouse, transformation and query; identity and consent engineering | Backlog, interface contracts, test scope and environments |
| Assurance | experiment analysis and quality checks | Control mapping, evaluation plan and remediation allowance |
| Run and exit | taxonomy governance and ongoing maintenance | Consumption model, support rota, retention and export plan |
Include internal labor and operational disruption, not just supplier invoices. Dual running, migration rehearsal, data repair, support training, audit participation and decommissioning are often real work even when absent from a proposal. Unit costs should follow the service's natural volume so growth can be explained. Contingency should correspond to documented unknowns, with a plan to resolve each one, rather than appear as an unexplained percentage. Budget specifically for instrumentation, warehouse processing and taxonomy governance.
Control the risks that shape delivery
The primary risks are concrete: event volume replaces decision clarity; schema drift changes metric meaning; identity stitching overcounts users; dashboards use conflicting definitions; experiments ignore guardrails; and analytics collection exceeds user expectations. Put each risk beside an early indicator, treatment, owner and stop threshold. Risk acceptance belongs to someone with authority over the consequence. Supplier assurances can inform due diligence, but they do not replace testing of the customer's configuration, workflow and shared-responsibility boundary.
| Risk | Early evidence | Practical treatment |
|---|---|---|
| event volume replaces decision clarity | A representative case cannot be traced end to end | Map the path with operators and test the missing dependency |
| schema drift changes metric meaning | Access, policy or ownership differs across environments | Automate the baseline and review exceptions with expiry |
| identity stitching overcounts users | Measured behavior diverges from the planning assumption | Set a threshold, investigate by segment and reforecast |
| dashboards use conflicting definitions | Recovery or reconciliation cannot restore trusted state | Rehearse rollback and preserve authoritative evidence |
| experiments ignore guardrails | Queue age or manual work rises during the pilot | Limit the wave and strengthen ownership and runbooks |
| analytics collection exceeds user expectations | Exit or substitution cannot be demonstrated | Test export, revocation, portability and continuity before scale |
Use a staged, reversible delivery plan
Use experiments where randomization and sample conditions are defensible; otherwise use careful observational analysis and state limitations. Guardrail metrics prevent local gains from hiding harm. A sound sequence is: frame the outcome and authority; discover real paths and dependencies; design contracts and controls; prove a thin end-to-end slice; pilot with a bounded population; expand only when thresholds hold; and retire old paths after consumers, records and obligations are reconciled. Every gate needs a decision maker and current evidence. Schedule pressure is not evidence that the next wave is safe.
- Frame: approve the outcome, owner, boundary, baseline, risk tolerance and exclusions.
- Discover: inspect representative cases, dependencies, data, permissions, controls, volumes and failure history.
- Design: document authority, contracts, security, evidence, recovery, support and cost assumptions.
- Prove: exercise the complete path with realistic data, failures, reconciliation and rollback.
- Pilot: limit exposure, increase review frequency and measure user and operational behavior.
- Expand: add scope only while outcome, control, cost and support thresholds remain acceptable.
- Retire: remove obsolete access, jobs, copies, contracts and runbooks after verified reconciliation.
Monitor instrumentation health, schema drift, late events, duplicates, consent behavior and dashboard usage. Retire events and reports when their decision no longer exists. Production readiness should be demonstrated by the people who will operate the service. Run a simulation that includes an ambiguous case, a dependency failure and an access problem. Observe whether teams can establish authority, protect data, communicate impact, preserve evidence and recover without uncontrolled edits. Feed gaps back into architecture, training and support. This is more revealing than a checklist signed before operators see the actual service.
Implementation review checklist
| Review area | Questions before expansion | Required artifact |
|---|---|---|
| Business | Did the target outcome improve for the pilot population? | Baseline comparison and owner decision |
| Data | Are authority, quality, lineage and retention understood? | Data contract and reconciliation result |
| Security | Do least privilege, logging and response work in practice? | Access review and scenario evidence |
| Operations | Can support identify, contain and recover failures? | Runbook exercise and open-gap register |
| Commercial | Do measured unit costs and provider duties match assumptions? | Updated forecast and responsibility matrix |
| Change | Can the team roll back and retire old paths safely? | Rollback result and decommission plan |
Key takeaways
- Scope the product decision supported by a defined user behavior and metric, not a product label.
- Make authority, evidence and failure behavior explicit before implementation.
- Estimate research and measurement design, identity and consent engineering and ongoing taxonomy governance and ongoing maintenance alongside build work.
- Treat event volume replaces decision clarity and dashboards use conflicting definitions as testable delivery risks.
- Expand through bounded waves with reconciliation, recovery and operational gates.
Frequently asked questions
Where should a product analytics program start?
Start with one important outcome and several representative cases. Name the owner, current baseline, users, systems of record, failure consequence and first reversible boundary. Then inspect enough real work to identify dependencies and exceptions before selecting tooling or committing to a portfolio timeline. A credible opening boundary is one product decision with a testable hypothesis.
How should cost be estimated?
Use a bottom-up range built from volumes, interfaces, environments, data condition, assurance depth, service objectives and support coverage. Separate discovery, implementation, transition and recurring operation. State assumptions, price the work needed to close unknowns and reforecast after the proof slice produces measured evidence. The main sizing variables are events, properties, identities, query volume and experiments.
What should be checked when selecting a provider?
Check functional fit, architecture, data handling, security, resilience, audit access, subcontractors, service management, pricing behavior and exit. Map every material responsibility to customer, provider or another party. Test a representative normal path and failure path rather than relying on a generic demonstration or certification. Require evidence for SDK behavior, raw-event access and taxonomy portability.
How should success be measured after launch?
Use the original outcome plus correctness, control effectiveness, reliability, exception age, user behavior, recovery performance and unit cost. Segment results where averages hide important populations. Delivery milestones show that work shipped; they do not prove that the service became safer, faster or more useful. Prioritize metric trust, experiment validity and decision usefulness.
Conclusion
Product Analytics should leave an organization with more than configured technology. It should create an owned service boundary, trustworthy evidence, operable controls and a realistic path for change. The disciplined approach is to begin with a consequential but bounded outcome, discover the real dependencies, design authority and failure behavior, prove the full path and expand only when operational evidence supports the decision.
That discipline also improves commercial judgment. Costs become connected to inspected work, supplier duties become explicit and risks become conditions the team can test. Most importantly, the organization retains the ability to pause, recover, reconcile and learn. A product analytics program is successful when the changed capability can be understood and operated under ordinary pressure as well as during the failure that planning hoped would never occur.