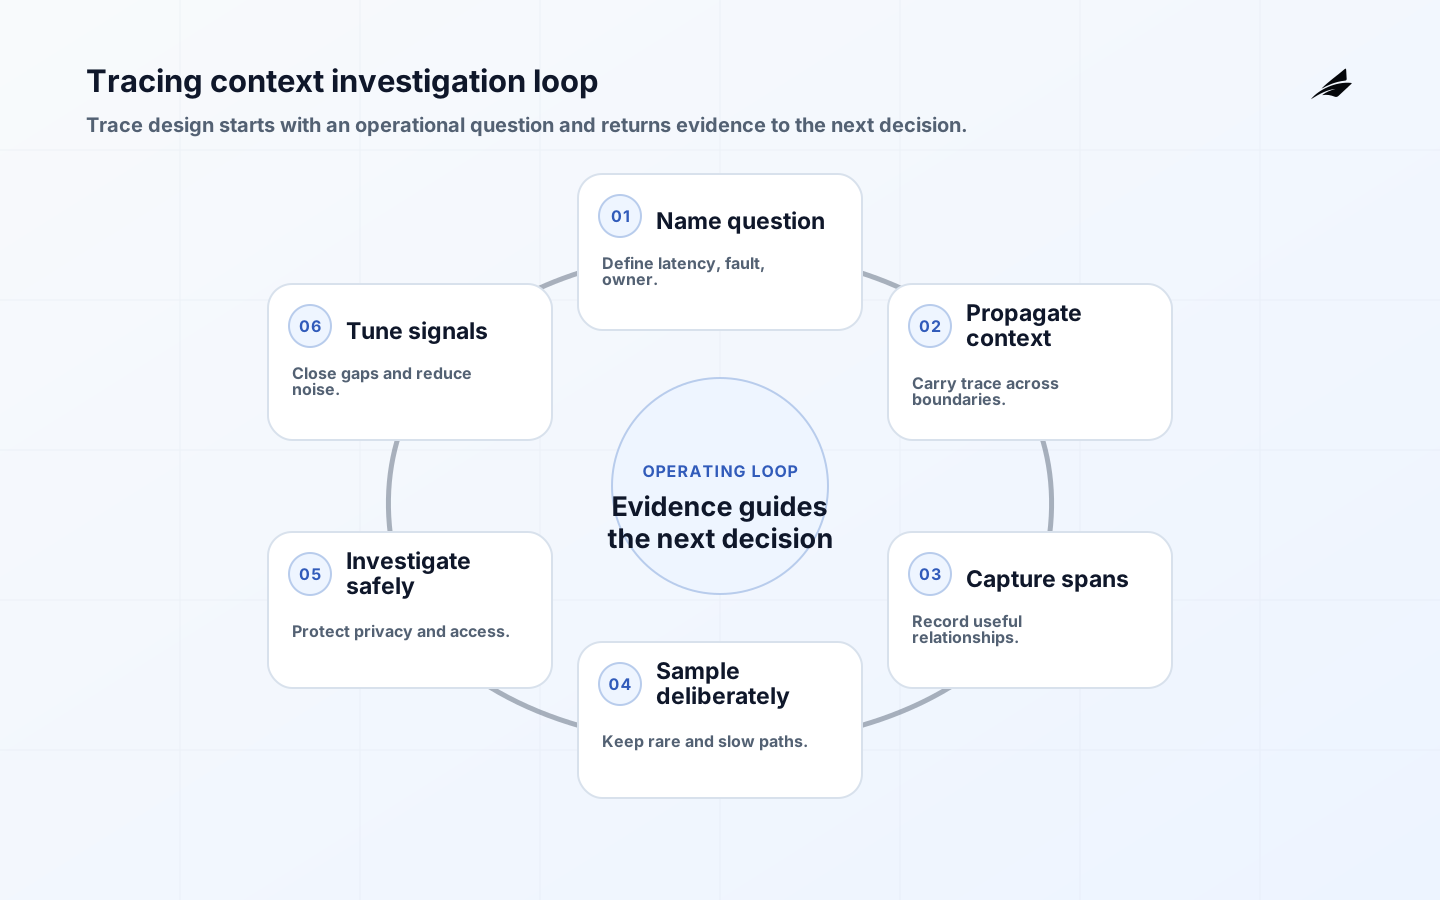
Distributed tracing should be treated as a trace boundary, not as a tool purchase or a YAML exercise. Before the first build, an engineering team needs to decide what it is trying to protect: a request can be followed across services without turning telemetry into a privacy or cost problem. That decision changes the design. The important record is not a screenshot of a successful run; it is a trace identifier plus the context that explains its effect. A trace can break at an asynchronous handoff, contain sensitive data, or be sampled away when the investigation needs it. The practical goal is a repeatable path that makes the next action clear to the person on call, the service owner, and the customer-facing team (for distributed-trace investigations operating boundary).
Trace the question, not every byte
Distributed tracing earns its storage and operational cost when it changes an investigation or a design decision. Start with the questions an operator needs answered: which request crossed the boundary, where did latency accumulate, which dependency failed, and which version or tenant context matters? Propagate the trace context across supported transports, but avoid copying sensitive payloads into spans merely because a collector can accept them. W3C Trace Context and OpenTelemetry's context propagation provide the interoperability baseline. The local policy should define which identifiers are safe, how long they live, and who may query them.

Sampling is an information policy, not only a cost setting. Preserve enough complete traces for rare errors, slow paths, and important workflow outcomes; use measured rules for routine traffic; and record how the sampling decision was made. OpenTelemetry's sampling guidance is useful when designing head or tail sampling, while its traces documentation explains spans and relationships. Test the result by asking an engineer to investigate a known failure using only the retained evidence. If the answer depends on a span that was regularly discarded, the policy is not aligned with the operating question.
Use Edilec's observability guide, log aggregation guide, and incident response guide to keep trace design connected to response. A trace should help a person choose the next safe action, not only produce a beautiful waterfall. Review cardinality, propagation gaps, privacy exceptions, and investigation outcomes regularly; each tells you whether the instrumentation is serving the service or merely collecting data.
- Name the investigation questions before selecting trace fields.
- Propagate context consistently across service and queue boundaries.
- Sample for rare failure and slow-path questions, not averages alone.
- Keep sensitive payloads out of spans unless policy explicitly permits them.
For a connected Edilec reading path, see Edilec CLD-0089, Edilec CLD-0095, Edilec CLD-0107. These related guides keep the implementation detail close to the operating decision and help teams compare ownership, evidence, and recovery across adjacent systems (for distributed-trace investigations trace question).
Key takeaways
- Start distributed tracing with one accountable owner and one customer-facing outcome.
- Use trace identifier as durable evidence rather than relying on memory or a mutable label.
- Design standard context propagation, semantic span names, explicit messaging links, sampling rules, attribute governance, and retention limits before scaling the workflow.
- Pair technical evidence with trace completeness for key flows, propagation failures, sampled error traces, query latency, and telemetry cost.
- Make the recovery action and its authority explicit before normal operation begins (for distributed-trace investigations key takeaways).
Define a trace boundary before implementation
The first design conversation for distributed tracing should produce a small, reviewable contract. State the system boundary, the trigger or change that crosses it, the owner who may decide, and the evidence required to proceed (for distributed-trace investigations define trace). Then identify the unhappy path: dependencies that time out, invalid state, untrusted input, capacity pressure, and a person who is unavailable (for distributed-trace investigations define trace). This is where teams turn a vague reliability ambition into operating choices (for distributed-trace investigations define trace). Standard context propagation, semantic span names, explicit messaging links, sampling rules, attribute governance, and retention limits are valuable because they reduce the number of assumptions a responder must reconstruct during pressure. Instrument one customer journey end to end and verify its context crosses every synchronous and asynchronous boundary. A purchase request can create a server span, propagate W3C trace context to inventory and payment calls, and link the later fulfillment message to the original trace without copying card or address data into attributes.
| Decision area | Evidence to retain | Why it matters |
|---|---|---|
| Context | Trace and span identifiers across boundaries | Connects causally related work |
| Span | Named unit with start, end, and status | Shows where time and failure occur |
| Attribute | Reviewed low-sensitivity dimension | Supports filtering without leaking data |
| Link | Relationship to an asynchronous parent | Preserves causality when a new process starts |
Make tracing risk visible
Distributed tracing work best when the safest route is also the easiest routine. Put the required checks and ownership near the action instead of relying on a separate document (for distributed-trace investigations make tracing). A team should be able to see the current trace identifier, the scope of change, and the next required decision from the same operational record. This does not mean every modification needs the same ceremony. It means the controls should match consequence: a bounded, reversible change needs fast automated evidence, while an irreversible or cross-system change needs compatibility checks, explicit authority, and a repair plan (for distributed-trace investigations make tracing). The purpose is not to slow delivery; it is to remove preventable ambiguity (for distributed-trace investigations make tracing).
Use trace evidence, not proxy success
A healthy tracing control plane does not prove that a customer request carried complete context. Trace completeness for key flows, propagation failures, sampled error traces, query latency, and telemetry cost should be examined together, over an agreed comparison window. Label or correlate the evidence with the relevant trace identifier where that is practical, and keep a baseline that represents normal behavior. Good evidence supports a decision with a short explanation: what changed, who is affected, which dependency is involved, and whether the impact is improving (for distributed-trace investigations use trace). This is also why distributed tracing needs a named owner for the signal, not merely a dashboard maintainer. The owner decides what response protects the service promise.
| Situation | Evidence and control | Decision rule |
|---|---|---|
| HTTP call | Propagate standard headers | Verify downstream span joins the trace |
| Message queue | Carry context or create a span link | Preserve producer-consumer investigation path |
| Unexpected error | Retain sampled trace with error details | Use it to locate failed dependency or code path |
| Sensitive attribute | Redact or omit at instrumentation | Do not rely on later dashboard filtering |
Start with one representative trace
Avoid beginning with a broad platform mandate. Pick a service or workflow that has an accountable team, a known customer outcome, and enough existing telemetry or records to compare before and after (for distributed-trace investigations start one). Run the new distributed tracing path through ordinary work, then through a controlled adverse case. Record what required manual judgment and why. That result is more useful than a generic scorecard because it exposes missing permissions, unclear handoffs, fragile dependencies, and inaccessible evidence (for distributed-trace investigations start one). The relevant production companion, distributed tracing production guide, gives additional operating detail once the first path is in use (for distributed-trace investigations start one).
Evaluate distributed tracing trade-offs
Tracing complements metrics and logs rather than replacing them. Metrics reveal that a population is degrading; a representative trace can explain an individual slow path; structured logs can preserve detailed events for the selected span. Design these joins deliberately with low-sensitivity correlation identifiers. Sampling is an operational policy: head sampling controls cost early, while tail-based choices can retain slow or erroneous traces when the backend supports them. Whatever policy is selected, document what investigations may miss. Trace context must also cross gateways, workers, and third-party boundaries safely. When a downstream partner cannot accept headers, record a bounded relationship locally instead of inventing an unreliable parent-child story.
Design trace recovery separately
Recovery is not always the inverse of execution. A previous revision may be available while data, external side effects, or declared state have already moved forward (for distributed-trace investigations design trace). Separate immediate containment from restoration and reconciliation. Define what can be disabled or paused, what evidence must be preserved, and what customer condition proves recovery (for distributed-trace investigations design trace). For changes that touch durable records, a compatible transition and a reconciliation query are often safer than a hurried reversal (for distributed-trace investigations design trace). The deployment rollback guide explains this distinction for releases; the same discipline applies whenever distributed tracing changes a live system.
Trace review checklist for distributed tracing
- Name the service owner, operational owner, and decision authority for distributed tracing.
- Confirm that trace identifier is retained with enough context to reconstruct an event.
- Exercise one realistic failure without relying on the original implementer.
- Check that permissions are scoped to the action and target actually required (for distributed-trace investigations trace review).
- Compare one customer outcome with technical telemetry before widening use.
- Write the containment action separately from the repair or reconciliation action.
- Set an expiry and an owner for every exception to the normal route (for distributed-trace investigations trace review).
- Use the next review to remove a repeated manual step or unclear handoff (for distributed-trace investigations trace review).
Frequently asked questions about distributed tracing
Question: What is the best first investment in distributed tracing? Answer: Trace one critical user path across its important service and asynchronous boundaries, with a clear question and privacy-aware fields. Question: Does distributed tracing require capturing every request detail? Answer: No. Collect the smallest context that answers the operational question, protects sensitive data, and keeps query cost manageable.
What is the best first investment in distributed tracing?
Start with the evidence that makes a single important path understandable after a handoff: its trace identifier, responsible owner, change or trigger, and customer outcome. That foundation makes later automation and standardization safer because teams can investigate a failure without relying on a particular person (for distributed-trace investigations best first).
Does distributed tracing remove human judgment?
Libraries can create and propagate spans, but they cannot decide which identifiers are sensitive, where boundaries are meaningful, or how much sampling is affordable. Those choices need joint ownership from application and platform teams.
How should a team measure success for distributed tracing?
Track trace continuity for critical journeys, propagation errors, useful error-trace coverage, query time, and telemetry spend. A large trace volume is unhelpful when the key customer path remains fragmented.
Practice a tracing system with a real scenario
A background fulfillment worker may begin long after a checkout request returns. Instead of pretending its processing span is a child that never ended, link the new trace context to the producer operation and retain the event identifier in a governed attribute. Investigators can then traverse the relationship without inventing timing.
Conclusion
Distributed tracing becomes dependable when its decisions are visible before the first build. Define a trace boundary, retain evidence around the trace identifier, match controls to consequence, and rehearse the action that contains harm. That approach creates faster engineering work because people do not have to rediscover the system while it is failing (for distributed-trace investigations conclusion). For closely related reading, see Distributed Tracing in Production: Context, Sampling and Investigation, Observability in Production: Signals, Decisions and Service Context, Incident Response in Production: Containment, Communication and Learning, Kubernetes Deployments in Production: Readiness, Capacity and Safe Rollout.
Validate trace usefulness with cases
Select a slow request, cross-region error, queue delay, dependency timeout, and authorization failure for a tracing review. Ask an engineer to locate the trace, follow context across boundaries, distinguish application time from queue and network time, and identify the next owner. Record missing propagation, misleading span names, excessive cardinality, and fields that exceed privacy policy. OpenTelemetry's traces documentation supports the model; the service team decides what evidence answers its response questions.
Repeat the exercise after a sampler, collector, gateway, or framework changes. A trace complete in staging can become partial in production because a queue, proxy, or vendor boundary drops context. Keep known cases and make their expected trace shape part of release testing. That gives the team an early warning when observability quality regresses, before an incident turns missing context into a long guessing exercise.