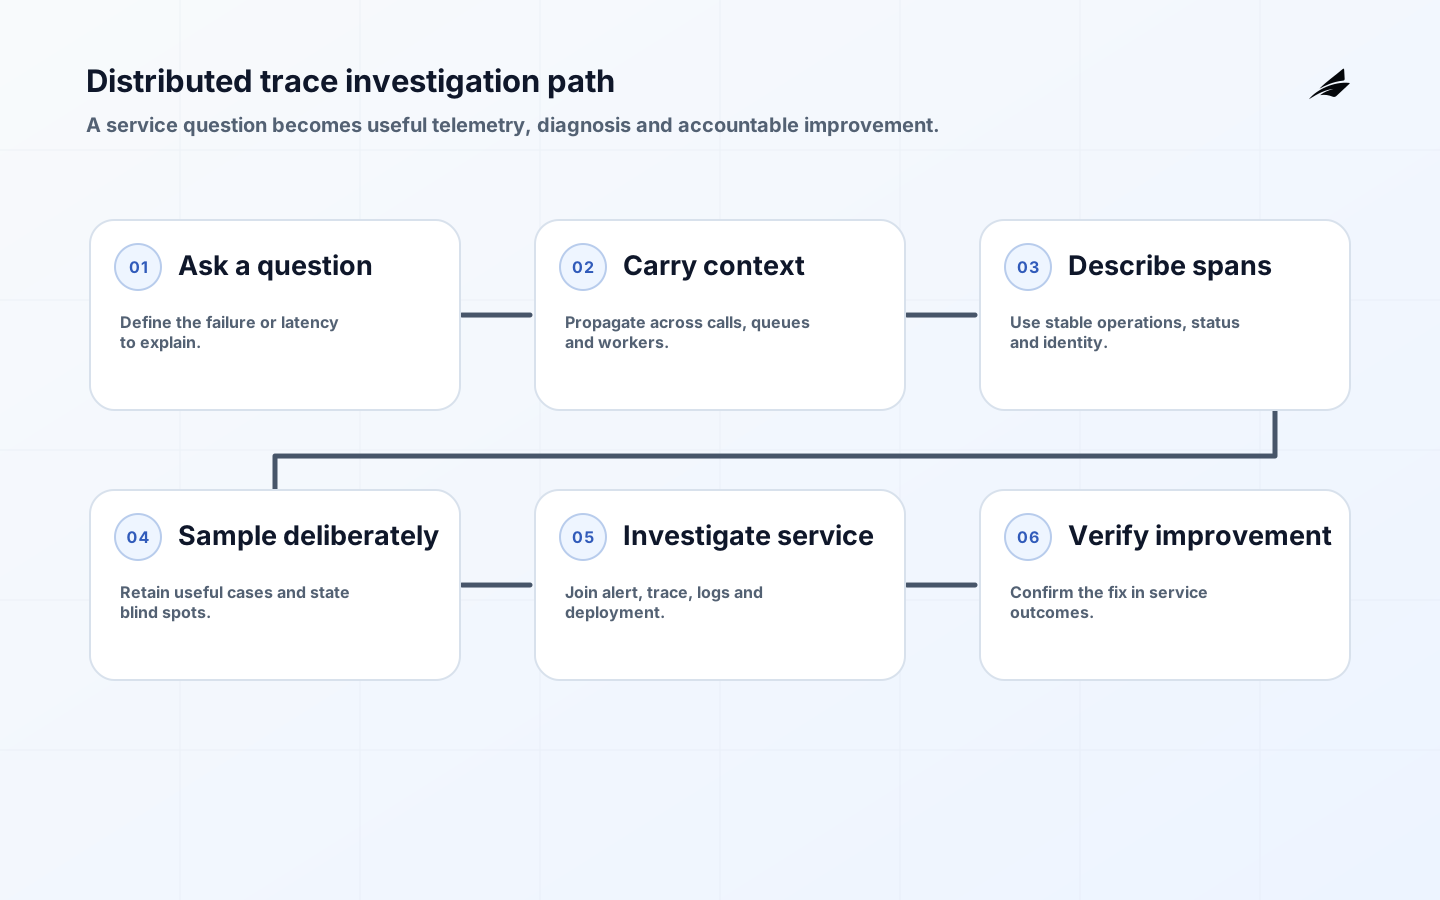
This distributed tracing guide is an implementation plan for a cloud team, beginning with a single production question: can a responder follow one customer operation from its entry point to the component that delayed or failed it? The deliverable is not a large span count. It is a verifiable chain whose boundaries, names, data controls, sampling behavior, and owner are understood before more services join.
Use the observability engineering notes to place traces beside metrics and logs, consult the distributed tracing architecture guide for platform choices, and connect the finished path to the roles in incident response planning. The production observability guide is useful when ownership and access move from a pilot into routine operations.
The implementation rests on a small standards base. W3C's Trace Context recommendation specifies the interoperable trace context fields. OpenTelemetry's context propagation guide explains how context moves between processes, while its observability primer distinguishes traces from the other signals operators still need. Google SRE's distributed-systems monitoring guidance is the check against collecting telemetry with no operational response.
Build one trace from a real incident question
Choose a thin vertical slice with a known symptom, such as an export request that sometimes exceeds its latency objective. Draw the actual runtime route: load balancer, API handler, authorization call, message producer, broker, worker, object store, and any vendor endpoint. For every arrow, record protocol, client and server library, owning team, retry behavior, and whether the boundary is synchronous, asynchronous, or outside your control. This inventory is the test plan; an unlabeled arrow is an unverified break.
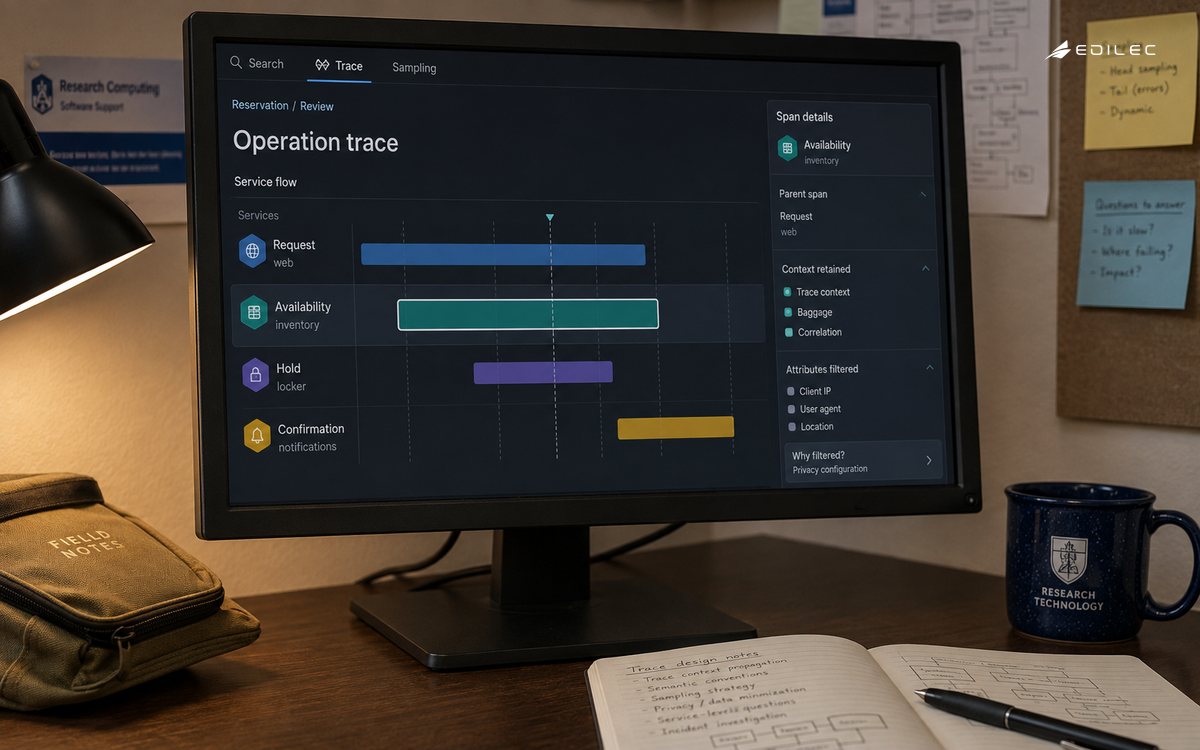
Instrument only that route first. Create an entry span at trusted ingress, child spans for meaningful remote calls, and distinct producer and consumer work around the message boundary. Send a synthetic request carrying a known test marker, then inspect the trace as a reader would: one root, correct parentage for request-response work, an intelligible causal relationship for queued work, visible errors, and durations that separate waiting from execution. Repeat with retries, cancellation, and a worker restart before declaring propagation complete.
- Inventory every boundary in one customer path and name its owner.
- Write one propagation contract for inbound, outbound, and queued work.
- Test parent-child continuity, async causality, retries, and cancellation.
- Approve semantic names and attributes before production export.
- Gate sampling changes with quality, cost, and rollback thresholds.
- Prove responders can navigate from an alert to an actionable trace.
Key takeaways
- Treat the boundary map and propagation contract as versioned production interfaces.
- A complete thin slice is more useful than partial instrumentation across every service.
- Measure trace correctness separately from backend availability and telemetry volume.
- Promote sampling only when test failures, privacy checks, and investigation drills pass.
Set the purpose and boundary for distributed tracing
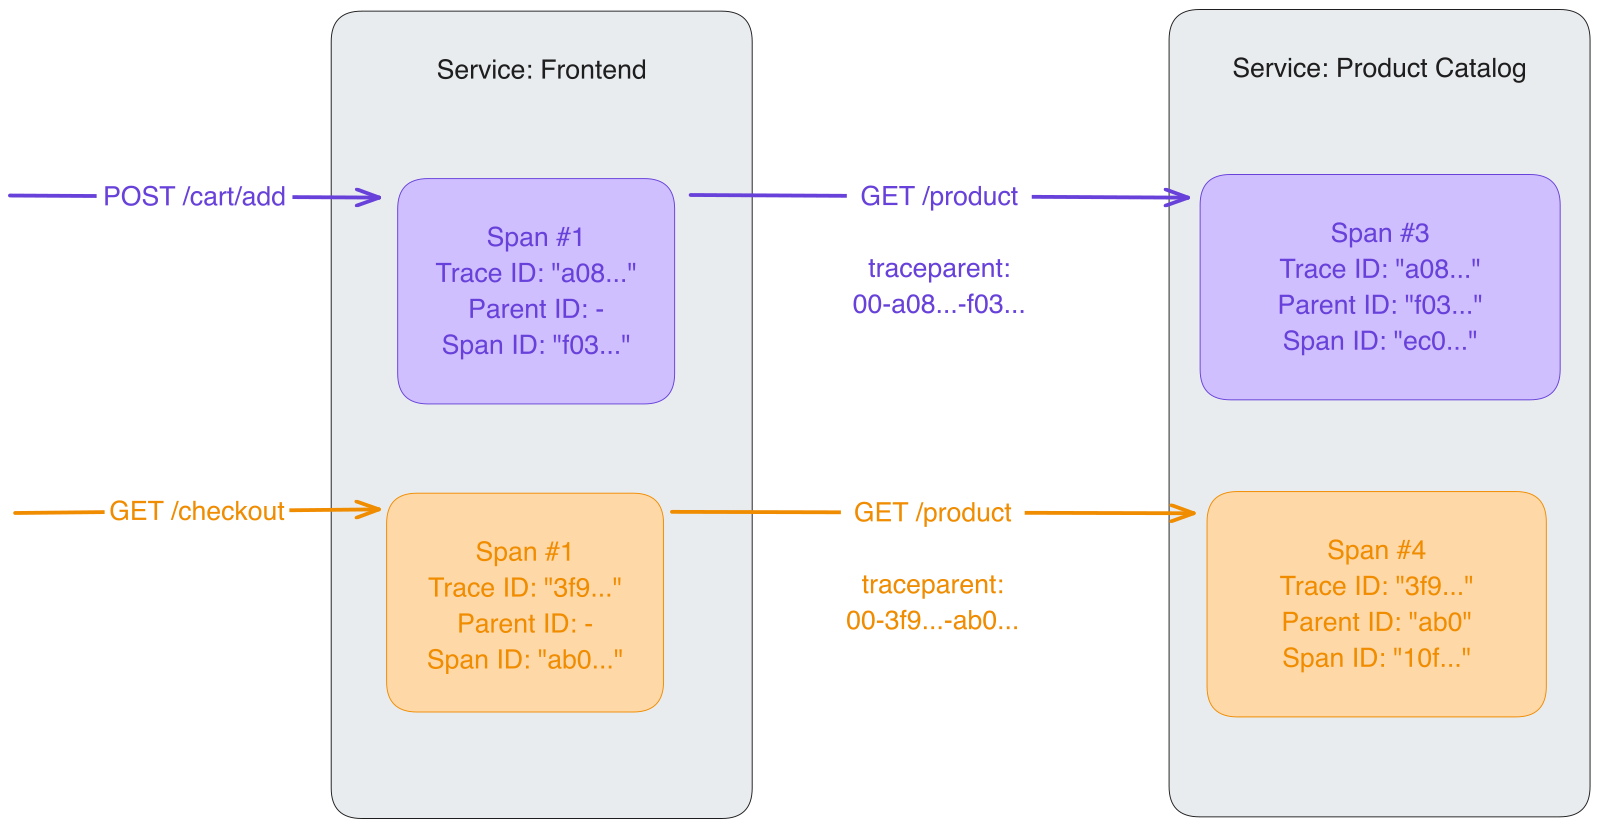
Turn the boundary inventory into a propagation contract that developers can implement and reviewers can test. Specify which ingress points may accept external context, how invalid input is handled, which W3C fields are forwarded, and where a new root is deliberately created. For each HTTP or RPC client, require context injection before the request leaves the process and extraction before server work begins. For messages, reserve metadata fields for context, define what the consumer restores, and state how fan-out, delayed delivery, and redelivery are represented. Do not put the contract in a platform slide; keep it beside interface definitions and test fixtures so a library upgrade cannot change it silently.
Define the trust boundary as carefully as the transport boundary. Accepting a trace identifier does not require accepting every accompanying value. Document whether partner calls receive context, which fields may cross accounts or regions, and when correlation ends at a provider reference. Add conformance tests that assert format, continuity, and absence of forbidden baggage. The expected result should be machine-checkable: a test request yields the intended topology, and a deliberately malformed carrier is rejected or replaced according to policy.
| Boundary test | Contract assertion | Evidence to retain |
|---|---|---|
| Public HTTP to API | Validate incoming context; start or continue exactly as policy states | Automated test plus trace topology |
| API to internal RPC | Inject current context and restore it before handler execution | Client and server span IDs |
| Producer to worker | Carry approved metadata; show enqueue and processing as separate work | Message fixture and consumer trace |
| Service to vendor | Stop propagation or send only allowed fields; record provider reference | Egress policy test |
Build an operating model for distributed tracing
Assign three explicit responsibilities. The service team owns manual spans, useful operation names, and tests for its boundaries. The platform team publishes supported instrumentation packages, collector configuration, compatibility rules, and a reference service. Security and privacy reviewers approve attribute classes, access, export destinations, and retention. Put each change through ordinary code review: instrumentation is production code, and collector or sampling configuration is a deployable revision. A named on-call owner must also know how to disable a faulty exporter or noisy rule without disabling the application.
Use proportionate controls and retained evidence
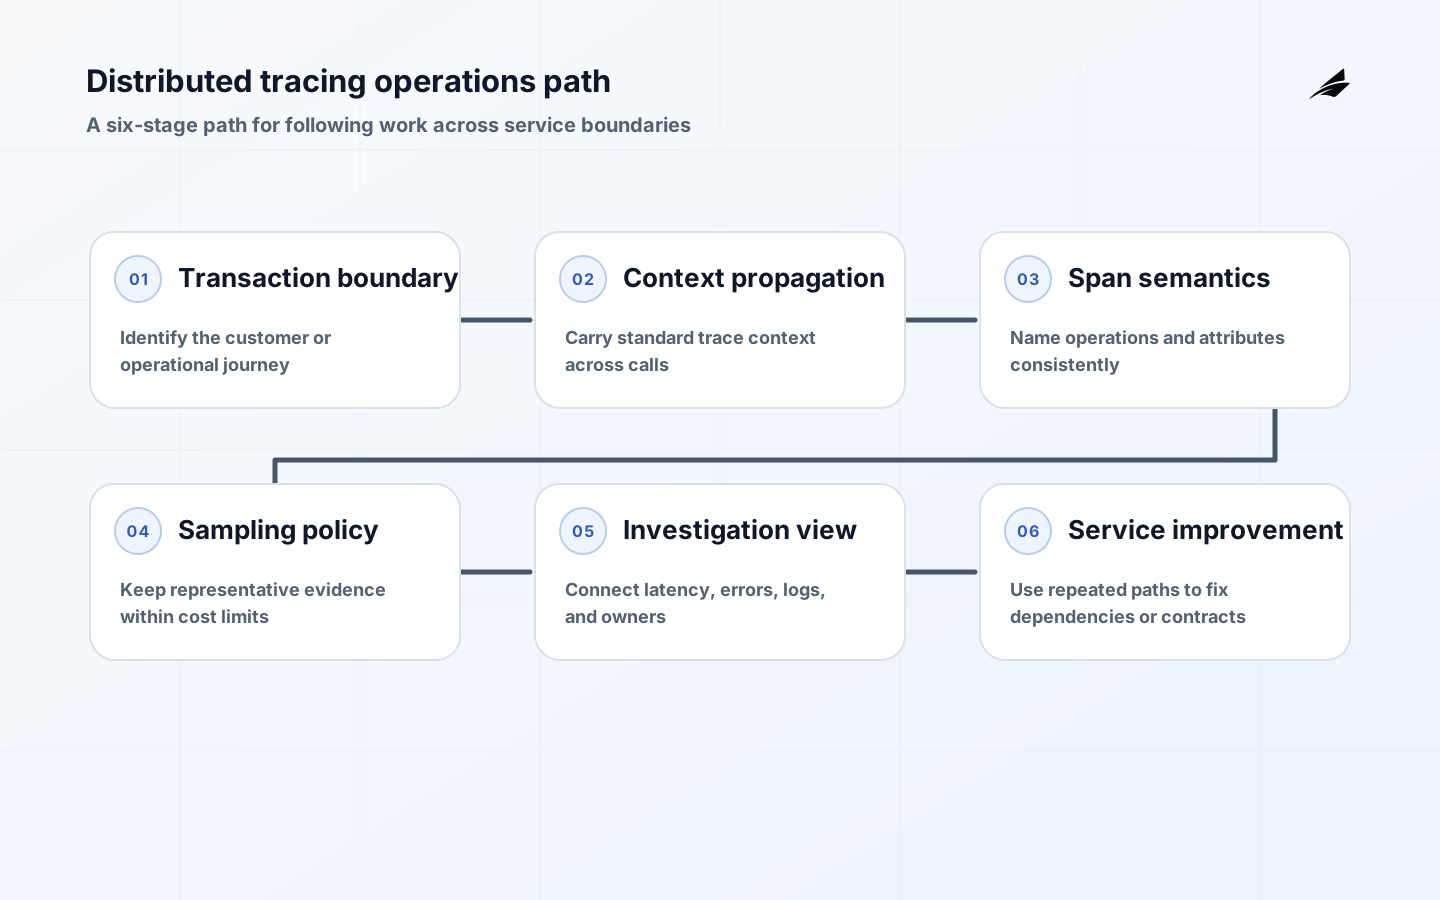
Create a semantic naming sheet before teams invent labels independently. Service identity should be stable across replicas and deployments. Span names should describe a bounded operation, not embed request IDs, customer names, raw URLs, or other unbounded values. Maintain an allowlist for attributes with purpose, source, type, cardinality expectation, classification, and retention owner. Reject secrets, authorization material, payload bodies, query text containing values, and direct personal identifiers unless a separately approved need exists. Enforce the rules as close to instrumentation as possible, then add collector-side filtering as defense in depth. Restrict trace search and export because even an approved dataset can disclose topology and activity patterns. Roll out sampling as a controlled change. Establish a low, representative baseline first, then verify that the selected approach preserves the investigations named in the opening question. Gate each increase or policy revision on collector saturation, export failures, ingestion delay, backend query performance, daily volume, and trace completeness. Define stop conditions and a tested rollback: for example, revert when dropped telemetry exceeds the trace-quality objective or cost crosses its approved envelope. Keep service metrics independent of trace sampling so a reduced sample never masquerades as reduced traffic or improved reliability.
| Rollout gate | Pass condition | Failure response |
|---|---|---|
| Propagation quality | Test journeys meet the completeness objective across every owned boundary | Hold expansion and repair the named integration |
| Attribute safety | Automated scan and reviewer sample find no prohibited fields | Block export, filter, and remove the producer |
| Pipeline health | Drops and ingestion delay remain within the declared trace-quality SLO | Restore the previous policy or shed noncritical data |
| Responder utility | On-call locates the injected fault and owner within the drill target | Fix navigation, naming, or coverage before widening |
Measure the service outcome and operating health
Define trace-quality SLOs around correctness and usability, not only pipeline uptime. Useful indicators include the share of synthetic reference journeys with the expected spans, the share of consumer spans carrying valid causal context, exporter rejection or drop rate, ingestion freshness, and successful trace lookup from an alert exemplar or request identifier. Measure these per critical journey and boundary; a fleet average can conceal one broken queue integration. Pair them with drill time to identify the faulting dependency and owner. Record the numerator, denominator, exclusions, and measurement source so the SLO cannot improve merely because sampling removed hard cases.
Adopt distributed tracing in deliberate increments
Use promotion stages that expose different failure modes. In development, prove the library creates the intended structure and does not leak attributes. In a shared test environment, exercise real proxies, service meshes, brokers, retries, and workers. In production, enable the thin slice for an internal or tightly bounded cohort, watch quality and cost gates, then widen traffic before adding another journey. At every stage save the configuration revision, test run, representative trace IDs, dashboard snapshot, exceptions, and approving owner. Teams may adopt the reference package only after its language runtime and transport combination appears in the compatibility matrix; novel combinations return to the test stage instead of inheriting an assumption.
Worked operating scenario
Suppose an image-processing API accepts a job, publishes it to a queue, and returns a job token. The worker downloads the source, calls a transformation service, stores the result, and updates status. The first trace ends at publish because the producer injects context into HTTP headers rather than message metadata. The team adds an approved carrier to the envelope, extracts it before worker execution, and creates spans that distinguish broker delay, download, transformation, and storage. A redelivery test then reveals duplicate consumer spans incorrectly shown as one continuous attempt. The revised convention records each attempt separately while preserving its relationship to the submitted job. During a drill, engineers delay the object store. The responder starts from the job token, finds the storage span, sees the affected worker deployment, and pages its owner. Completion status and full-population latency metrics confirm recovery; the trace explains the path but does not substitute for that confirmation.
Run a readiness review for distributed tracing
Schedule an incident drill before general availability. Give the on-call engineer an alert or customer identifier, not a prepared trace link. Inject latency into one downstream dependency and drop context at a second boundary. Ask the responder to locate a representative trace, distinguish the service fault from the observability fault, identify both owners, and state what independent signal proves customer recovery. Readiness evidence is concrete: approved boundary map and contract, passing sync and async fixtures, attribute scan, sampling revision and rollback result, quality-SLO dashboard, access review, drill timeline, found defects, and dated remediation owners. Re-run the affected check after correction and repeat the drill when a critical transport, runtime, topology, or owner changes.
Frequently asked questions about distributed tracing
Should every log have a trace ID?
No. Add trace and span identifiers to structured logs emitted while an active context exists and when the correlation helps an investigation. Background maintenance and unrelated process events should remain honest about having no request context. Test cleanup after each request so pooled threads or reused workers cannot attach the next customer's logs to the previous trace.
How long should traces be retained?
Choose retention from the longest legitimate investigation window, access model, data classification, and cost envelope. Detailed traces can justify a shorter period than aggregate metrics. Verify deletion in the backend and any export destination, document who may extend retention during an incident, and expire that exception explicitly.
How should a team test asynchronous propagation?
Publish a fixture with known context, consume it through the real broker and worker library, and assert the resulting causal relationship. Repeat for delayed delivery, fan-out, retry, dead-letter movement, redelivery, and processing after restart. Also send a message without context and one with malformed metadata to verify the documented fallback.
Can automatic instrumentation finish the job?
It is a starting point for supported frameworks and common transports. The team still has to validate topology, add spans around meaningful business or queue work, choose stable names, control attributes, and cover custom clients. Keep a regression fixture because framework and instrumentation upgrades can alter behavior.
What proves sampling is safe to widen?
Show that reference journeys remain complete, known injected failures are discoverable, pipeline drops and freshness satisfy the trace-quality SLO, and backend cost stays inside the approved range. Then demonstrate rollback to the prior policy. Sampling approval should name the traffic cohort and expiry or next review, not authorize an unlimited fleet change.
Conclusion
A useful tracing rollout leaves behind more than telemetry: it produces a boundary inventory, an executable propagation contract, a readable reference journey, controlled attributes, reversible sampling, measurable trace quality, and a rehearsed investigation. Begin with one thin path and require evidence at every promotion gate. When the on-call engineer can locate a fault, name its owner, and verify recovery with independent service signals, the tracing system is ready to expand.