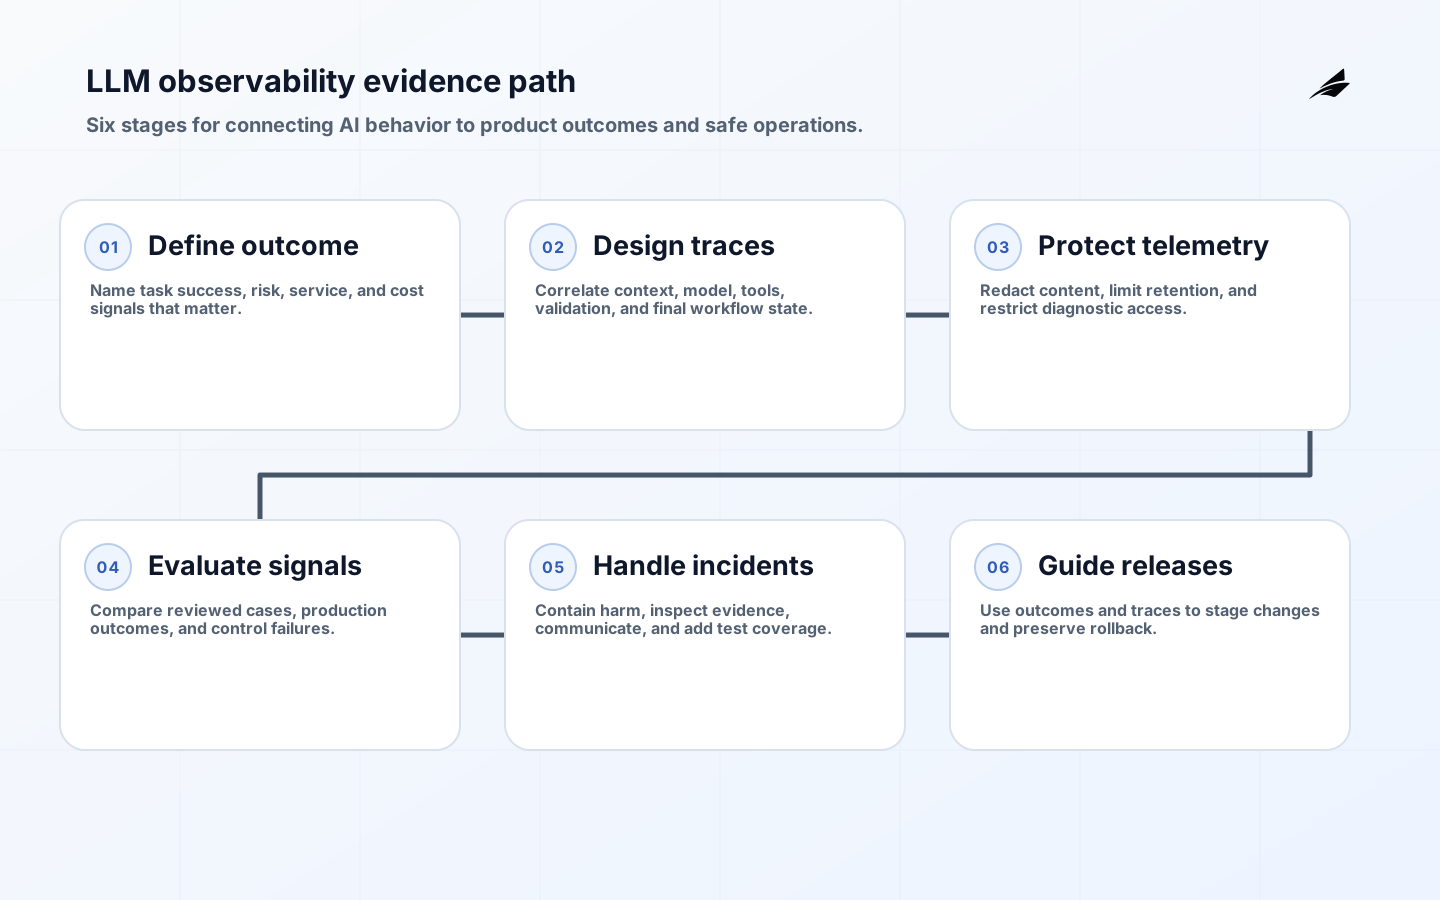
LLM observability is the ability to understand how an AI-enabled workflow behaved and why. A founder does not need a dashboard full of tokens and trace IDs for their own sake. They need evidence that connects a customer or business outcome to the inputs, retrieval, model behavior, tool calls, policy checks, latency, cost, and human intervention that produced it. Without that path, a team cannot distinguish a product problem from a source-data problem, a prompt regression from a provider outage, or a safe refusal from a frustrating dead end. The NIST Generative AI Profile supports this focus on measurable, contextual risk management.
Start With The Outcome
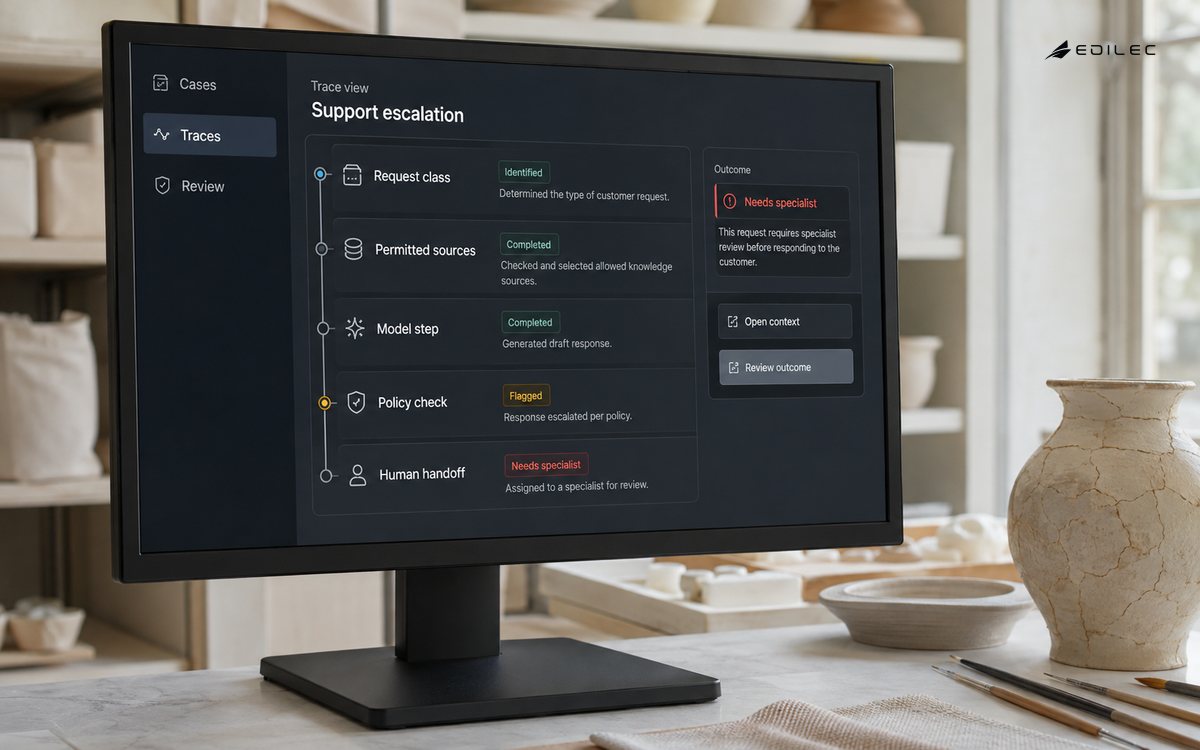
Choose the few outcomes that make the AI feature worth operating. For a support workflow, that may be correct resolution, appropriate escalation, and reduced repeat contact. For a document workflow, it may be verified extraction, exception turnaround, and downstream match rate. Then ask what evidence is needed when the outcome is poor. A useful trace should let a reviewer see the workflow version, request class, permitted context sources, model or provider configuration, retrieval or tool steps, validation result, and final state. It does not need to retain every raw prompt forever. This outcome-first approach keeps observability tied to product decisions rather than an expensive collection hobby.
| Question | Signal | Decision it supports |
|---|---|---|
| Did the task succeed? | Completion, correction, escalation, or verified downstream result. | Whether the feature creates value for the intended workflow. |
| Was the result grounded? | Retrieved source identifiers, citation checks, and source freshness. | Whether users can rely on claims or need more review. |
| What did it cost? | Latency, model and tool usage, retry count, and review effort. | Whether the unit economics support broader rollout. |
| Did controls hold? | Authorization, validation, refusal, and policy-check outcomes. | Whether increased use expands unacceptable risk. |
Trace The Whole Workflow
Instrument the application path, not just the model request. One user interaction may involve authentication, a feature flag, retrieval, a model call, a tool invocation, validation, an approval queue, and a write to a system of record. Correlate these steps with a trace or request identifier so an operator can reconstruct the path. The OpenTelemetry GenAI semantic conventions provide common attributes for model operations and evaluation signals, while warning that message content can be sensitive. Adopt stable naming and low-cardinality dimensions where possible, then add business-specific fields deliberately rather than scattering opaque labels across services.
- Record workflow, prompt, model, tool, and policy versions for meaningful interactions.
- Capture source identifiers and validation outcomes rather than indiscriminately storing full content.
- Propagate one correlation identifier across asynchronous handoffs.
- Track retries, fallbacks, and partial failures as part of the user experience.
- Make sampling and retention rules explicit for any content-bearing telemetry.
Protect Sensitive Telemetry
Observability can create a second copy of the sensitive data an AI system was meant to protect. Decide which fields are necessary for diagnosis, hash or tokenize identifiers where useful, redact content before export, restrict access, and set retention by purpose. A trace that stores a customer’s full conversation and retrieved documents may be convenient during a debug session but unacceptable as a default. Preserve enough safe evidence to investigate: version, event time, source references, policy result, structured error, and approved evaluation labels can often explain a failure. OWASP guidance is relevant because sensitive disclosure can happen through logs as readily as through an answer.
Use Evaluation And Production Signals
Offline evaluations tell a team whether a proposed release performs on reviewed cases; production signals reveal how it behaves in the changing world. Connect the two. When a customer correction or incident occurs, create a safely redacted evaluation case and classify its cause. When a release improves the standing set but increases production escalations, inspect differences in input distribution, data freshness, user behavior, and latency. Do not use an LLM-as-judge score as the only alert. Calibrate evaluators against accountable review and combine them with deterministic checks and outcome metrics. The model evaluation guide explains how those evidence sets should evolve.
| Pattern | Likely explanation | Investigation path |
|---|---|---|
| Latency rises, quality stable | Provider, retrieval, or tool dependency is slowing. | Break down spans and examine retries, queue time, and downstream calls. |
| Quality drops after content update | Context changed while model configuration did not. | Compare source versions, filters, and retrieval candidates. |
| Costs rise with longer conversations | Context accumulation or retries are growing. | Inspect turn length, summarization, fallback, and cache behavior. |
| Corrections cluster by customer type | The workflow boundary or data coverage is uneven. | Segment evaluation and review access, terminology, and source availability. |
Run An Incident And Release Routine
Define what counts as an AI incident: unauthorized disclosure, unsafe action attempt, systemic unsupported claims, prolonged degraded mode, or a high-cost regression. Give teams a runbook that identifies the owner, trace evidence, containment action, customer communication path, and follow-up evaluation. For releases, compare the candidate to the current system on both quality and control signals, stage exposure, and retain rollback capability. The NCSC guidance is helpful because it treats monitoring and incident management as first-class lifecycle work. A founder should be able to ask “what changed, who was affected, and what did we do?” and receive a concrete answer.
Build An Observability Practice In Layers
Start with a small event model that every AI workflow can emit: request or case identifier, workflow and release version, request class, model and tool identifiers, timing, validation outcome, final status, and a safe reference to source evidence. Add content-bearing attributes only after a privacy review demonstrates that they are necessary for a defined diagnostic purpose. Instrument one complete workflow end to end, then test that a support or engineering responder can answer a real incident question without assembling clues from five systems. Standardize the names and ownership of those events before scaling instrumentation across products.
Set a routine for turning telemetry into action. A weekly quality review may examine a small sample of failed or corrected cases; a monthly service review may inspect trends in cost, latency, control failures, and source freshness; an incident review may add new regression cases. Tie every dashboard metric to a decision owner and an expected response. For example, a rise in unsupported claims might pause rollout, while a rise in tool timeout errors might engage the platform team. This avoids the familiar fate of monitoring: plenty of data, no shared conclusion, and no change in the service that customers actually use.
| Observability check | Evidence of readiness | Owner |
|---|---|---|
| Trace completeness | One sample interaction links application, retrieval, model, tool, validation, and final outcome. | Engineering owner. |
| Privacy review | Recorded attributes have a purpose, access rule, and retention period. | Security and data governance owner. |
| Alert usefulness | A test signal reaches a named responder with a specific runbook action. | Operations owner. |
| Release comparison | Candidate and baseline reports use the same measures and definitions. | Product and release owner. |
Cost observability should include the whole work unit. An inexpensive model response that triggers three retries, a long retrieval operation, and manual correction may cost more than a slightly larger initial request that completes correctly. Conversely, a low-latency path may be worth its cost for a time-sensitive workflow but not for a background summary. Attribute costs to product tasks and segments, then compare them with value and risk. This gives founders a clearer basis for pricing, capacity planning, and investment than a platform-wide token total that nobody can connect to a customer outcome.
Make trace access part of incident preparedness. The people expected to respond need training, safe query paths, and permission to inspect the evidence they need without creating uncontrolled exports. A trace is only useful when the organization can use it quickly and responsibly during a real customer-impacting event.
Review observability coverage whenever the workflow gains a new retrieval source, model provider, tool, approval stage, or asynchronous queue. Each addition can create a blind spot if the trace no longer connects the user event to the eventual business outcome. Coverage is a property of the workflow, not a one-time instrumentation project.
Retain a small set of trace-based examples for training responders and verifying dashboards after instrumentation changes. Synthetic examples can show the expected shape of a timeout, blocked authorization, citation failure, and successful handoff without exposing customer content. They make observability practice repeatable across people and releases.
When metrics disagree, investigate the user journey rather than averaging them away. A stable model score alongside worsening resolution is a signal that context, interface, or downstream workflow behavior has changed.
That investigation should finish with an owner, due date, and a measurable service improvement.
Key Takeaways
- Begin with user and business outcomes, then instrument the evidence needed to explain them.
- Trace context, model, retrieval, tools, validation, and final workflow state together.
- Protect telemetry with minimization, redaction, access controls, and retention rules.
- Connect production corrections and incidents back to the evaluation set.
- Use observability to drive release, incident, and investment decisions.
Frequently Asked Questions
Should we log every prompt and response? Usually not by default. Log the minimum useful metadata and use carefully controlled sampling or approved diagnostic capture where content is genuinely required. Treat content telemetry as sensitive data.
What is the first dashboard to build? Start with a workflow view that combines task outcome, failure or handoff rate, latency, cost, and control failures. It is more actionable than a model-only dashboard.
Conclusion
LLM observability is how an organization turns an opaque interaction into an operable service. Trace the full workflow, protect the evidence you collect, and connect technical signals to customer outcomes and risk. That gives founders a basis for shipping, stopping, and improving AI features with their eyes open.