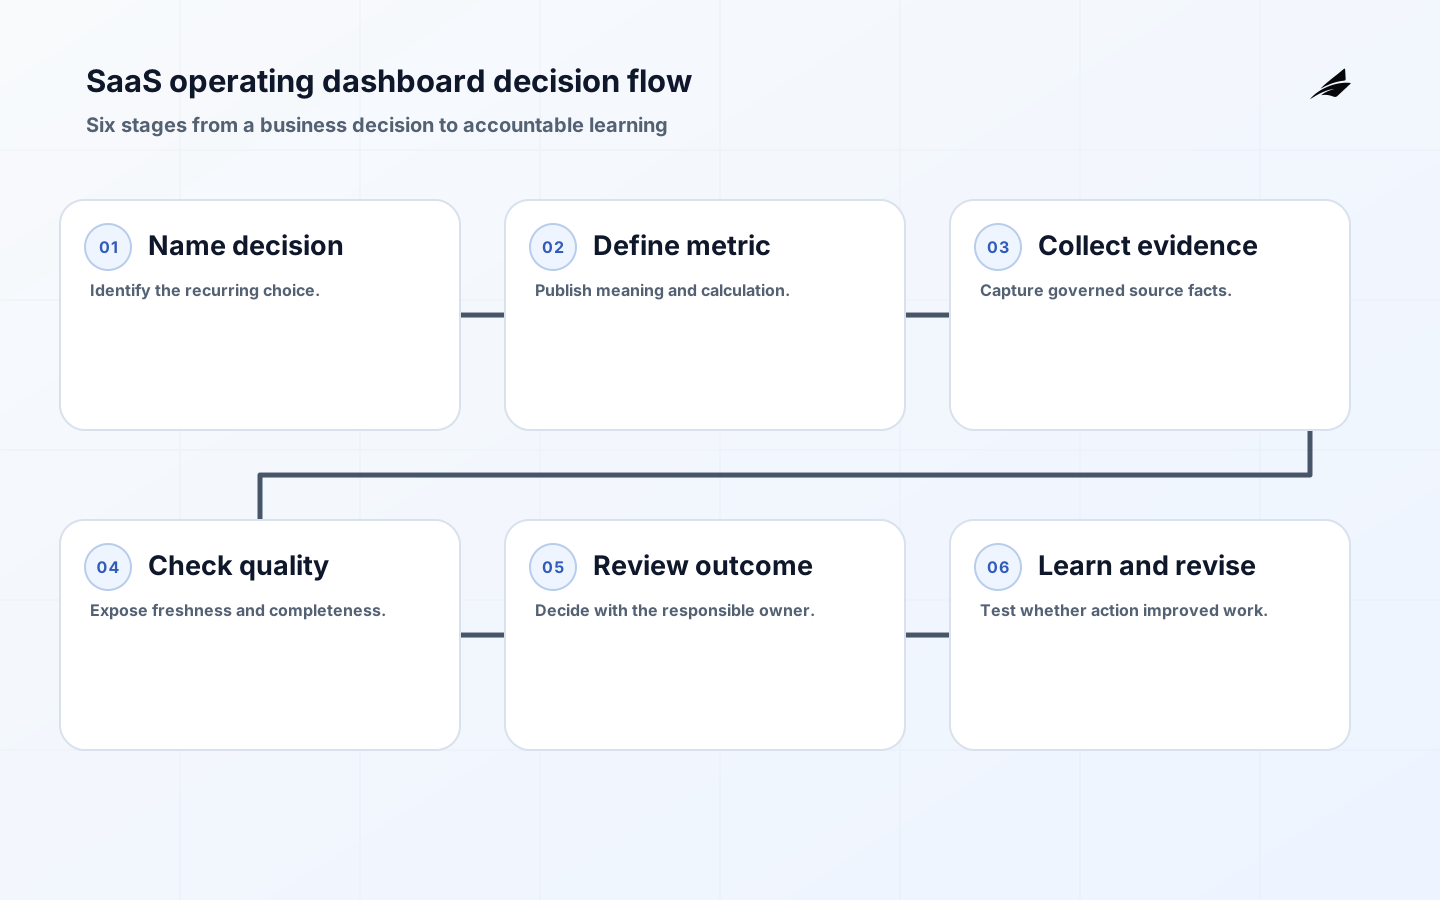
A business operating dashboards checklist for SaaS growth begins with the decisions a leadership team must make repeatedly. A dashboard is not a shared spreadsheet with more charts. It is a compact agreement about the customer, product, revenue, service, and risk signals that trigger a decision, the people authorized to act, and the evidence available when the signal is challenged. Start by observing an operating review. Note which questions lead to action, which figures are recalculated in the meeting, and which teams disagree about a definition. Those moments identify the work a dashboard must support and the definitions it must protect.
Start with decision rights and review cadence
For each measure, name a decision, an accountable owner, a review rhythm, and a permitted action. Net revenue retention might support a customer investment decision; support backlog might trigger staffing or escalation; activation completion might require a product or onboarding change. Do not give every executive every raw metric. Instead, expose the level of detail appropriate to the decision and preserve a route to investigate surprising results. Write the decision rule in plain language. If no one can say what changes when the number moves, the measure may be interesting but it does not belong in an operating dashboard.
| Measure | Decision it supports | Definition control |
|---|---|---|
| Activation completion | Whether onboarding needs intervention. | Cohort, qualifying action, and time window. |
| Recurring revenue movement | Whether retention and expansion work needs focus. | Contract status, currency rule, and effective date. |
| Support backlog age | Whether customers face a service risk. | Queue scope, business hours, and pause states. |
| Product reliability | Whether release or capacity action is required. | Service boundary, incident severity, and source timestamp. |
Write metric contracts before building charts
A metric contract should state the business meaning, numerator, denominator where relevant, source systems, grain, time zone, refresh expectation, exclusions, owner, and known limitations. Version the contract when a definition changes, and label historical breaks rather than silently reclassifying prior periods. This prevents a familiar SaaS failure: finance, product, and customer success each report a plausible but incompatible retention number. The goal is not one database table. It is one accountable interpretation for a stated purpose, with enough lineage that an analyst or reviewer can reproduce a result.
Engineer data-quality signals beside business signals
Every important dashboard should reveal whether its data is complete, fresh, and within expected bounds. Track late loads, unmatched identifiers, duplicate events, unexpected nulls, and reconciliation differences separately from the headline measures. Set thresholds that create owned work rather than decorative alerts. For example, a missing subscription-to-account match should be assigned to the data steward, while a delayed product event pipeline belongs with the platform owner. Keep failed source records accessible for diagnosis and preserve the source timestamp; replacing a stale number with a newer number without context makes incident review harder.

| Failure pattern | Response | Review evidence |
|---|---|---|
| Late source feed | Show last successful refresh and suspend affected decisions. | Run log and owner acknowledgement. |
| Definition change | Version the metric and explain the comparison break. | Approved contract and release note. |
| Duplicate customer event | Deduplicate using documented keys and retain the original event. | Duplicate rate and sample review. |
| Unexpected movement | Drill to cohort and source before declaring a trend. | Query lineage and decision record. |
Make access proportionate to the decision
SaaS dashboards often combine commercial, usage, and support data that should not be broadly exported. Separate aggregated leadership views from account-level investigation views, and control who may see sensitive attributes or download rows. Apply the same discipline to embedded dashboards and scheduled exports. A well-designed access model lets a manager answer a service question without acquiring an unnecessary customer data set. Review access when roles change, and retain evidence of material exports. This protects people and also makes the dashboard easier to trust across finance, sales, product, and operations.
Run the operating review as a decision forum
Use the dashboard before the meeting so participants arrive with questions, not a first glance at the numbers. In the review, distinguish observation from explanation and explanation from action. Capture decisions, owners, due dates, and the measure that will show whether the action helped. Revisit prior actions in the next cadence. This makes the dashboard part of a feedback loop instead of a report card. When a number is disputed, inspect its contract and lineage rather than bargaining over which team has the nicer chart.
Implementation checklist
- Map each dashboard measure to a recurring decision and owner.
- Publish a metric contract before the chart is treated as authoritative.
- Show freshness, completeness, and reconciliation signals alongside results.
- Limit drill-down and export access to what the decision requires.
- Record decisions and revisit them in the next operating review.
- Version definitions and retain history when business rules change.
Frequently asked questions
How many measures should an executive dashboard contain? Use only what a single review can responsibly discuss. A small set of linked measures is stronger than dozens of targets, because it leaves room to check data quality and decide what to do. Create separate operational views for teams that need more detail, but keep their definitions aligned with the shared contracts.
Can a dashboard use estimates? Yes, when the estimate is named, its method and uncertainty are visible, and users know which decisions may rely on it. Do not present an estimated value as settled accounting or customer truth. Mark the owner and review date so the estimate does not become an unexamined permanent number.
Implementation evidence worksheet
- SaaS operating dashboard checkpoint 1: Write the business outcome in one sentence and name the person who can accept that outcome on behalf of the organization.
- SaaS operating dashboard checkpoint 2: List every material state, its entry condition, its permitted next states, and the evidence that proves a change is legitimate.
- SaaS operating dashboard checkpoint 3: Create a field register for identifiers, effective dates, owner, sensitivity, source, consumer, and correction route before configuring automation.
- SaaS operating dashboard checkpoint 4: Run a normal case and a deliberately incomplete case with the people who will operate the process; capture every manual step and undocumented decision.
- SaaS operating dashboard checkpoint 5: For every handoff, state what the sender guarantees, what the receiver validates, how duplicate delivery is handled, and who owns a rejection.
- SaaS operating dashboard checkpoint 6: Define a customer-safe or requester-safe status for each delay so frontline staff can explain progress without exposing internal notes or speculation.
- SaaS operating dashboard checkpoint 7: Prepare a reconciliation that compares counts, material values, state, and age between the initiating record and the resulting operational record.
- SaaS operating dashboard checkpoint 8: Choose thresholds that open owned work rather than merely sending alerts; record the queue, service target, escalation point, and recovery authority.
- SaaS operating dashboard checkpoint 9: Test a failed dependency, an out-of-order update, an unauthorized action, and a correction after downstream work has begun; retain the resulting evidence.
- SaaS operating dashboard checkpoint 10: Document which roles may read, change, approve, export, administer, or override the process, including temporary access and delegated authority.
- SaaS operating dashboard checkpoint 11: Keep original context when a fact is corrected: prior value, source, time, actor or process, reason, approving authority, and correlation identifier.
- SaaS operating dashboard checkpoint 12: Publish the smallest useful contract for each interface or report: purpose, scope, required inputs, freshness expectation, limits, owner, and support route.
- SaaS operating dashboard checkpoint 13: Rehearse a support conversation around a confusing or delayed case so the communication path is as deliberate as the technical recovery path.
- SaaS operating dashboard checkpoint 14: Inspect a sample of completed cases for evidence quality, not only elapsed time; a quick result that cannot be explained is not an operational success.
- SaaS operating dashboard checkpoint 15: Set a release decision with explicit go, hold, and rollback criteria, and identify who can make each decision when information is incomplete.
- SaaS operating dashboard checkpoint 16: Use a short post-release review cadence that pairs operational measures with a few real cases and records a single accountable improvement for each finding.
- SaaS operating dashboard checkpoint 17: Version rules, definitions, mappings, and approval thresholds. Explain historical comparison breaks rather than silently replacing prior meaning.
- SaaS operating dashboard checkpoint 18: Minimize the data carried into the workflow or view, and review access, retention, sharing, and export behavior against the stated business purpose.
- SaaS operating dashboard checkpoint 19: Identify the workaround that experienced staff use today, then decide whether the target design should formalize, retire, or replace it with an owned exception.
- SaaS operating dashboard checkpoint 20: Give every exception a stable identifier, severity, current state, next action, accountable owner, and a link to the business record it affects.
- SaaS operating dashboard checkpoint 21: Confirm training with hands-on completion of a real task and an exception, rather than attendance alone; update the runbook from what the exercise reveals.
- SaaS operating dashboard checkpoint 22: Review recurring overrides and repeated corrections as design evidence. They often signal unclear policy, bad data, missing capacity, or a brittle integration.
- SaaS operating dashboard checkpoint 23: Protect audit and operating evidence from routine cleanup. Retention and retrieval instructions should let a future reviewer reconstruct a material decision.
- SaaS operating dashboard checkpoint 24: End the implementation review by deciding what evidence would prove the next expansion is safe, useful, and supportable for the people doing the work.
Key takeaways
- A dashboard earns attention by supporting a named decision.
- Metric contracts and lineage prevent plausible but incompatible reporting.
- Data health belongs beside business performance.
- Operating reviews should end with owned actions, not commentary.
Conclusion
Business operating dashboards support SaaS growth when they convert shared facts into accountable decisions. Define each measure before visualizing it, expose the quality of its inputs, protect sensitive detail, and use a regular review to learn from action. The result is not merely faster reporting; it is a calmer operating system for making trade-offs as the company grows.