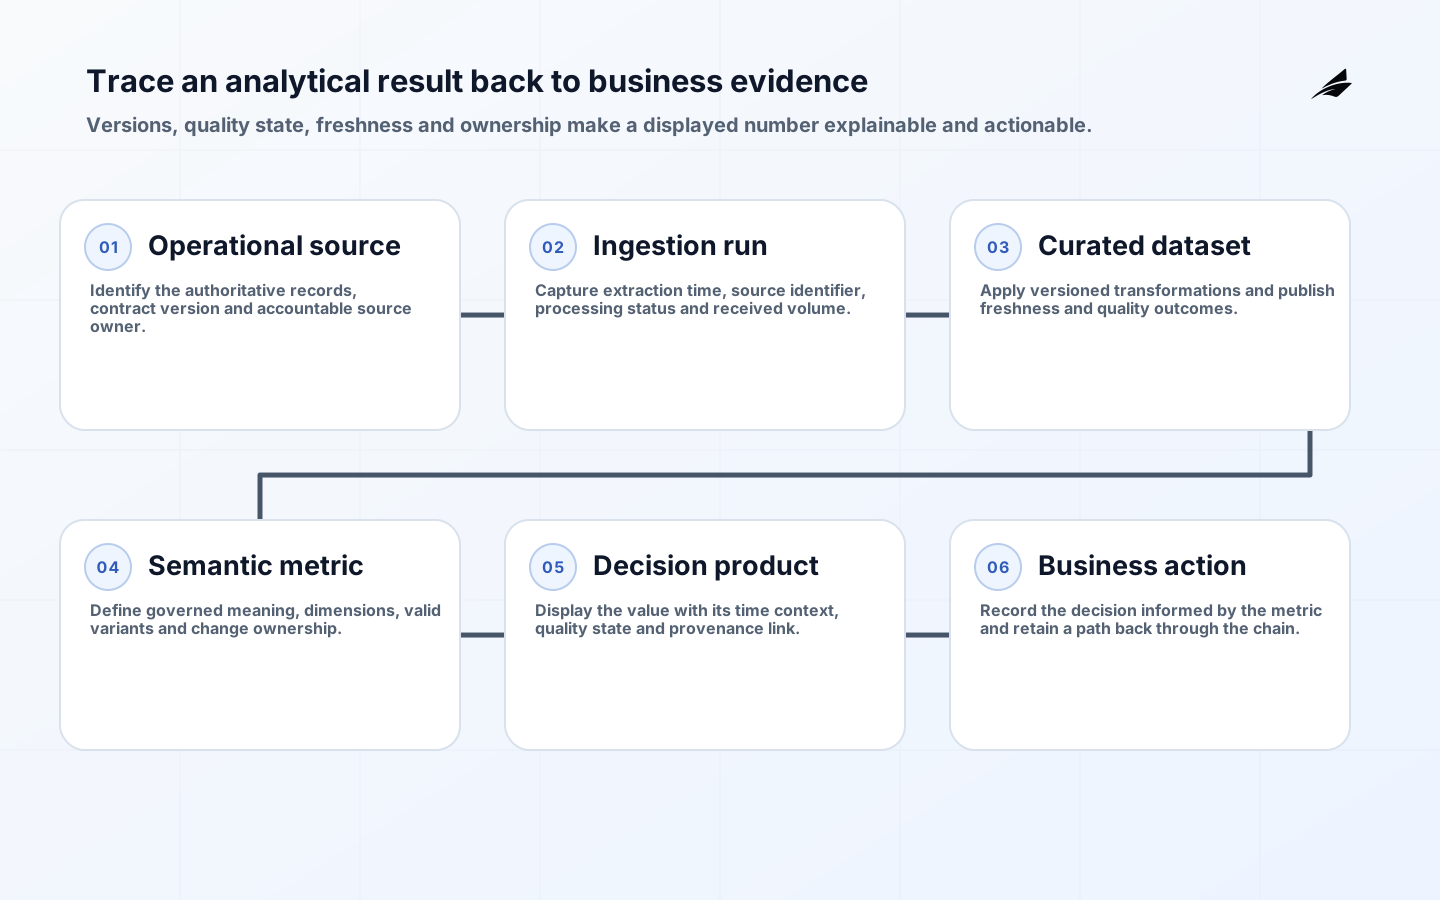
Analytics enterprise integration connects operational data, transformation pipelines, semantic definitions, analytical products and the decisions they inform. It is not complete when data lands in a warehouse or a dashboard renders. It is complete when users can understand meaning and freshness, trace important results to source, handle quality failures and operate the flow through change.
The planning challenge is to integrate enough of the enterprise to support a decision without creating an endless data-consolidation program. This guide uses a decision-first scope, an evidence-based cost model and a phased rollout that treats lineage, privacy and operations as core delivery work.
Scope an analytics decision product
Begin with a decision and audience. For example, an operations manager may need to prioritize delayed orders each morning. Define the action, required dimensions, tolerated delay and consequences of error. Then identify the minimum source records and business rules. Starting from every available table produces broad pipelines before meaning and value are agreed.
Define the analytical product: dataset, semantic model, API, report, alert or combination. Name its owner and service expectation. Document grain, identifiers, calculations, filters, time basis and late-arriving behavior. A metric name such as active customer is not a definition; it needs eligibility, time window, exclusions and source authority.
| Scope layer | Decision to make | Acceptance evidence |
|---|---|---|
| Decision | Who acts, when and with what consequence? | Scenario and named outcome owner |
| Data product | What reusable dataset or metric serves the decision? | Contract, grain and owner |
| Sources | Which records and fields are authoritative? | Source map and sample lineage |
| Service | How fresh, complete and available must it be? | Measurable service expectations |
| Experience | How are uncertainty and exceptions shown? | Reviewed dashboard, alert or API behavior |
Design the enterprise data flow
Map ingestion, storage, transformation, semantic and consumption layers, but avoid assuming each must be a separate product. Select batch, change-data capture, events or queries according to source capability and required latency. Preserve source identifiers and extraction time. Separate raw capture from curated meaning so corrections can be reproduced.
Use contracts at important boundaries: schema, ownership, quality expectations, update cadence and compatibility policy. A contract does not eliminate change; it makes producer and consumer obligations visible. For shared data products, publish discoverable metadata. DCAT 3 provides a vocabulary for describing datasets and data services in catalogs.
Govern semantics and lineage together
A semantic layer should define measures, dimensions and relationships once for its governed audience, with visible version history. Do not force one definition where business contexts legitimately differ. Qualify variants and name their owners. Changes to a widely used metric require impact analysis, communication and, when necessary, a parallel transition.
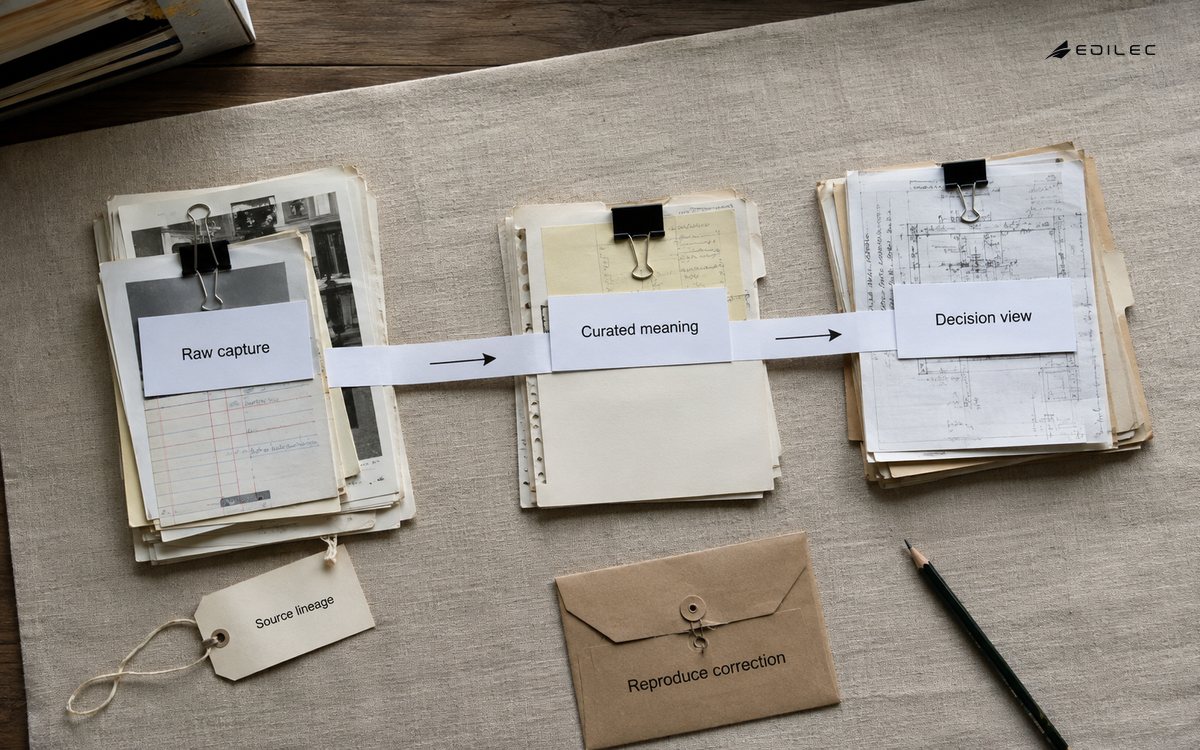
Lineage should connect source datasets, transformations, runs and outputs at a useful level. OpenLineage defines events for jobs, runs and datasets; W3C PROV provides a broader provenance vocabulary. Tool-generated lineage still needs business context and ownership. Prioritize critical metrics, regulated fields and high-impact decisions instead of promising perfect field-level lineage everywhere.
Make data quality observable and actionable
Define quality rules from use: validity, completeness, uniqueness, consistency, timeliness and appropriate accuracy evidence. ISO/IEC 25012 offers a general data quality model, but thresholds must reflect the decision. A missing optional contact field and a duplicated payment identifier do not have equal consequence.
Measure quality at source boundaries and after consequential transformations. Route failures by severity: block publication, publish with a visible warning, quarantine affected records or create a correction task. Data observability should include pipeline telemetry and product state. OpenTelemetry can standardize traces, metrics and logs for services, while data-specific checks cover freshness, volume and rule outcomes.
| Quality failure | Possible policy | User-facing behavior |
|---|---|---|
| Late source extract | Use last approved snapshot within tolerance | Show data timestamp and stale warning |
| Schema incompatibility | Stop affected transformation | Keep prior product and alert owners |
| Invalid key | Quarantine records | Expose excluded count and correction queue |
| Metric rule change | Run versions in parallel | Label definitions and effective dates |
| Partial regional data | Suppress unsafe comparison | Explain coverage and expected recovery |
Design privacy, security and access at data level
Classify data and document purpose, lawful or organizational authority, retention, residency, sharing and deletion needs with qualified owners. NIST's Privacy Framework supports risk-based privacy management, while CSF 2.0 frames cybersecurity outcomes. Neither substitutes for applicable legal advice or sector obligations.
Apply least privilege to source, transformation and consumption roles. Mask or aggregate fields when detail is unnecessary. Protect service credentials and separate production duties. Row- and column-level controls need tests that cover exports, cached extracts and downstream tools, not just the primary dashboard. Audit access to sensitive products and review entitlements on a schedule.
Estimate the full analytics integration cost
Cost depends on source accessibility, data condition, history, latency, transformation complexity, semantic disagreement, privacy controls, consumers and support expectations. Storage and query charges may be visible, but discovery, reconciliation and ownership often determine the schedule.
| Cost area | Drivers | Evidence that narrows the estimate |
|---|---|---|
| Source onboarding | API or database access, history, change capture, limits | Source profile and extraction proof |
| Modeling and transformation | Grain, joins, slowly changing attributes, metrics | Representative model and reconciliation |
| Quality and governance | Rule count, lineage depth, cataloging, stewardship | Critical-data inventory and owner availability |
| Experience | Dashboard, API, alerts, accessibility, export needs | Prototype tested against decisions |
| Run operation | Compute, storage, licenses, monitoring, support | Volume model and service calendar |
Separate platform consumption, licenses, implementation and recurring stewardship. Include parallel runs, backfills, test environments, retention and egress. Estimate ranges should state source volumes, update cadence, history, expected users and quality assumptions. Run profiling before fixing a migration estimate; table count does not reveal semantic or data-condition complexity.
Manage analytical integration risks
| Risk | Impact | Control |
|---|---|---|
| Metric ambiguity | Teams act on incompatible numbers | Owned definition and effective version |
| Silent source drift | Pipelines run but meaning changes | Contract monitoring and producer notice |
| Untraceable transformation | Results cannot be explained | Prioritized lineage and reproducible runs |
| Privacy overexposure | Users receive unnecessary detail | Purpose-based minimization and access tests |
| Fresh but incomplete data | Dashboard creates false urgency | Completeness gates and coverage display |
| Low adoption | Users retain private spreadsheets | Workflow research and governed export path |
Keep a risk register tied to data products and decisions. Assign triggers such as freshness breach, unexplained reconciliation difference or access exception. Avoid declaring quality solved after a one-time cleanup. Sources and definitions evolve, so controls need owners and review cadence.
Deliver through bounded data-product releases
Phase one frames the decision, metric and owner. Phase two profiles sources and proves access. Phase three defines contracts, semantics, privacy and quality policy. Phase four builds a thin end-to-end product with lineage and observability. Phase five runs in parallel with the current decision process and reconciles differences. Phase six expands consumers and sources only after trust and support evidence are strong.
- Frame the decision, consequence, audience and service expectation.
- Profile real source data and document authority and constraints.
- Baseline contracts, metric definitions, quality rules and access policy.
- Build one reproducible flow through to a usable analytical experience.
- Parallel-run, reconcile and explain differences with domain owners.
- Expand by governed data product and retire duplicate reports deliberately.
Use gates based on evidence. Before pilot, require a reviewed metric definition, representative reconciliation, access tests and visible freshness. Before replacing a report, identify every consumer, subscription, export and downstream calculation. Keep old and new definitions side by side when differences are intentional; hiding a break behind a renamed dashboard erodes trust.
Operate analytics as a portfolio of products
Assign product owners, data stewards, platform operators and source contacts. Publish support and change procedures. Review source notices, failed quality rules, access, cost and consumer feedback. Treat metric and schema changes as releases with compatibility decisions and effective dates.
Measure decision adoption, product freshness, quality-rule outcomes, lineage coverage for critical elements, reconciliation differences, exception age, support effort and unit consumption. Query counts may indicate use but not value. Pair them with whether the intended decision is made on time and whether users understand uncertainty.
Migrate consumers and retire reports deliberately
An existing report may feed meetings, scheduled emails, spreadsheet models, regulatory work or another application even when catalog usage looks low. Inventory consumers through telemetry, subscriptions, embedded links, exports and interviews. Ask what decision each consumer makes and which filters or manual adjustments they apply. Hidden transformations in personal spreadsheets are requirements evidence, not merely undesirable behavior.
Publish a comparison between old and new products that separates defects from intentional definition changes. Reconcile representative periods and edge cases with domain owners. If historical figures change because a rule was corrected, state the effective definition and whether history is restated. Preserve an accessible record of prior definitions so users can explain earlier decisions.
| Migration step | Required evidence | Retirement gate |
|---|---|---|
| Discover | Consumers, subscriptions, exports and downstream calculations | Named owner for every material use |
| Compare | Metric, filter, timing and coverage differences | Domain approval of intended differences |
| Pilot | Parallel decisions and resolved discrepancies | Users can complete the workflow on the new product |
| Retire | Archive, redirect, access removal and support communication | No unowned consumer or scheduled output remains |
Retirement should remove scheduled jobs, credentials, extracts and support obligations, not only hide a dashboard link. Keep evidence according to retention policy and redirect users to the governed replacement. Monitor attempts to access the old product and rapid growth in new private exports; both can reveal a missed requirement or a confidence problem that needs investigation.
Plan backfills separately from the recurring pipeline. Historical sources may use different identifiers, definitions and quality controls, and a backfill can consume capacity needed by current decisions. Define the historical period that genuinely supports analysis, test reconciliation by period and record which rules were applied. If complete history cannot be made comparable, label the boundary instead of presenting one continuous trend.
For machine-learning or automated decision consumers, treat the analytical product contract as an upstream dependency with additional consequence. Record training or evaluation data versions, features and applicable quality limits, and monitor distribution or schema changes through the owning governance process. Do not infer model suitability from a pipeline's successful completion; evaluation and human oversight remain separate responsibilities.
Key takeaways
- Begin with a decision and a bounded analytical product, not all enterprise data.
- Define grain, authority, metric semantics and service expectations explicitly.
- Prioritize lineage, quality and privacy according to decision consequence.
- Estimate source work, reconciliation, governance and operation alongside platforms.
- Replace existing reports only after consumer discovery and explainable parallel runs.
Frequently asked questions
Do we need a central warehouse or lakehouse first?
Not necessarily. A shared platform can help governance and reuse, but the architecture should follow required products, source capabilities and operating skills. Prove one governed flow before expanding the platform boundary.
Does analytics need real-time integration?
Only when the decision needs it and sources can support it reliably. Define acceptable staleness. Scheduled or incremental processing may provide better cost and reproducibility for many planning decisions.
Who owns data quality?
Source owners own source behavior, data-product owners own fitness for the analytical use, and platform teams own processing reliability. Business stewards decide meaning and consequence. Make those responsibilities explicit rather than assigning quality to one central team.
How do we know the integration is trusted?
Users can explain definitions and freshness, critical results trace to source, differences are reconciled, access is appropriate and the product supports the intended decision. Trust is demonstrated through behavior and evidence, not a launch survey alone.
Conclusion
Analytics enterprise integration succeeds when data arrives with meaning, provenance, quality state and an owner. A decision-first scope limits waste, while contracts, lineage and parallel reconciliation make change explainable. Build a thin, controlled path to one useful decision, then expand the governed products that prove their value.