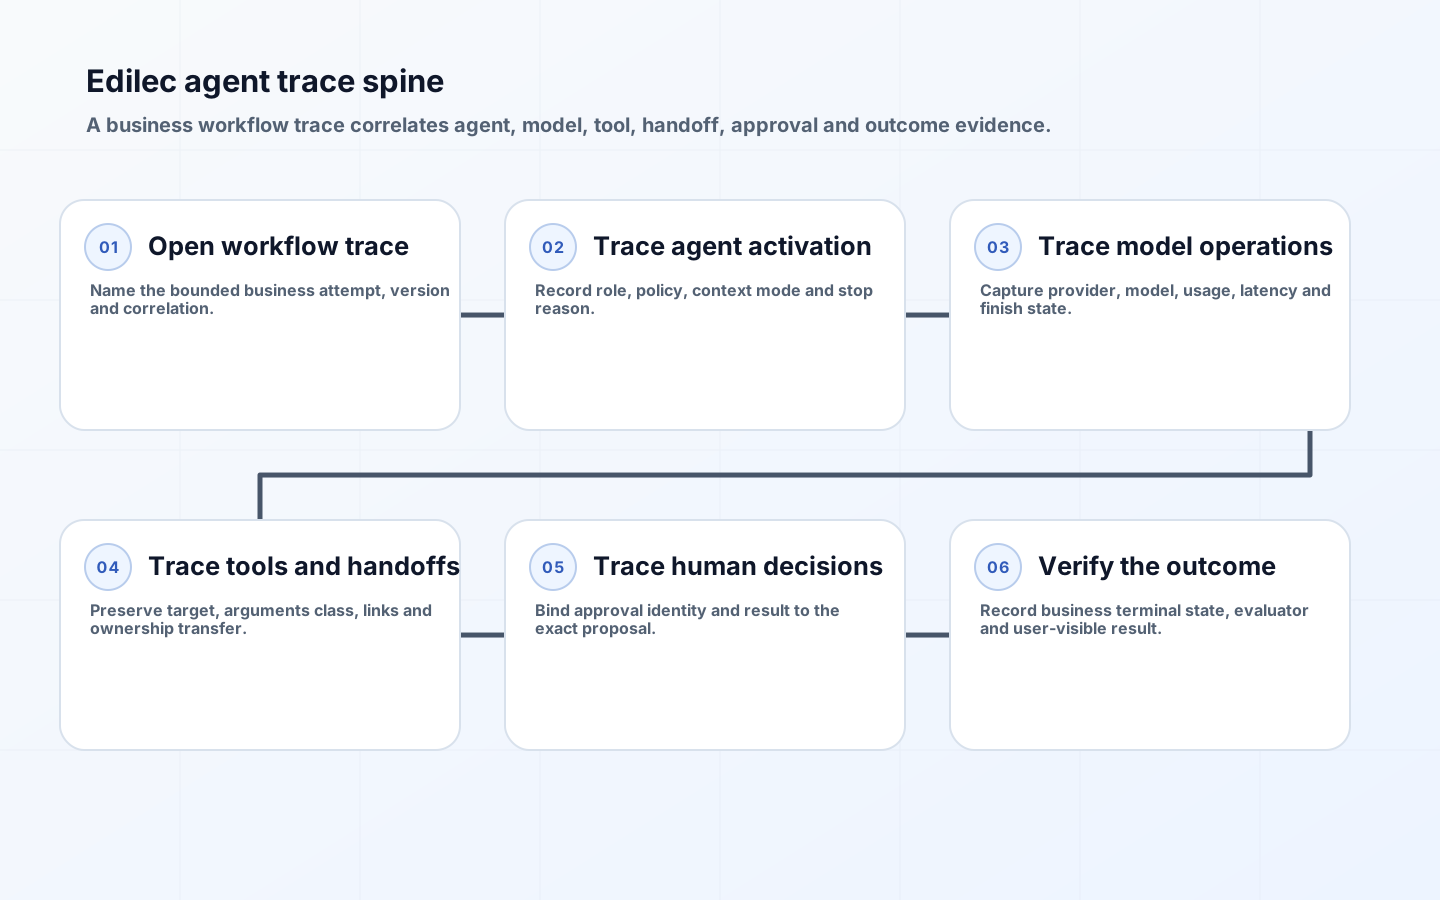
OpenTelemetry AI agent tracing connects a business workflow to the agents, model calls, tool operations, handoffs and approvals that carry it out. The goal is not to store every prompt. It is to create a stable causal record that lets an operator answer: what work was attempted, which component made each decision, where time and tokens went, what external state changed, why the run stopped and whether the user received a useful outcome.
The OpenTelemetry GenAI semantic conventions provide a vendor-neutral vocabulary for generative AI operations. The OpenAI Agents SDK tracing guide illustrates traces containing agent, generation, function, guardrail and handoff spans, and warns that generation and function spans may contain sensitive inputs and outputs. A production design combines common semantics with an enterprise workflow model and privacy policy.
Start with operational questions
Define the decisions telemetry must support before instrumenting libraries. Product owners need completion, abandonment and review outcomes. SREs need latency, dependency and saturation evidence. AI engineers need model, context and tool trajectories. Security teams need authority decisions and unusual data paths. Privacy teams need to know what content is collected and why. One trace can support all of them when identifiers, boundaries and retention are designed deliberately; indiscriminate payload capture serves none safely.
Choose a top-level unit of work that matches the business transaction: resolve a case, prepare a refund, reconcile an order or draft a contract. A chat turn may be smaller than the workflow, while a conversation may be much larger. Create a workflow trace for the bounded attempt and link related attempts through a non-sensitive correlation identifier. Record final disposition separately from HTTP success. A technically successful response that leaves the case unresolved is not an operational success.
Use a stable span hierarchy across frameworks
| Span | Represents | Key attributes | Avoid by default |
|---|---|---|---|
| Workflow | One business attempt | workflow name, version, tenant class, disposition | Raw user identity |
| Agent | One agent activation | agent role, policy version, stop reason | Full instructions |
| Model | One generation request | provider, model, operation, usage, finish reason | Prompt and completion bodies |
| Tool | One external capability call | tool name, operation, target class, result status | Arguments containing secrets |
| Handoff | Transfer between agents or services | source role, target role, reason, context reference | Duplicated context payload |
| Approval | Interruption and reviewer decision | risk tier, proposal hash, decision, actor class | Unnecessary reviewer details |
| Outcome | Business state verification | state transition, evaluator version, success class | Sensitive record contents |

Parent spans when work is causally nested. Use span links when a queued worker, external agent or resumed approval continues work outside the original process lifetime. Do not force asynchronous operations into a false synchronous tree. Propagate standard trace context only across trusted boundaries and validate incoming headers to prevent arbitrary correlation or sampling manipulation. At an organizational boundary, create a new local span and link to the permitted remote identifier rather than sharing unrestricted baggage.
Preserve service and agent boundaries
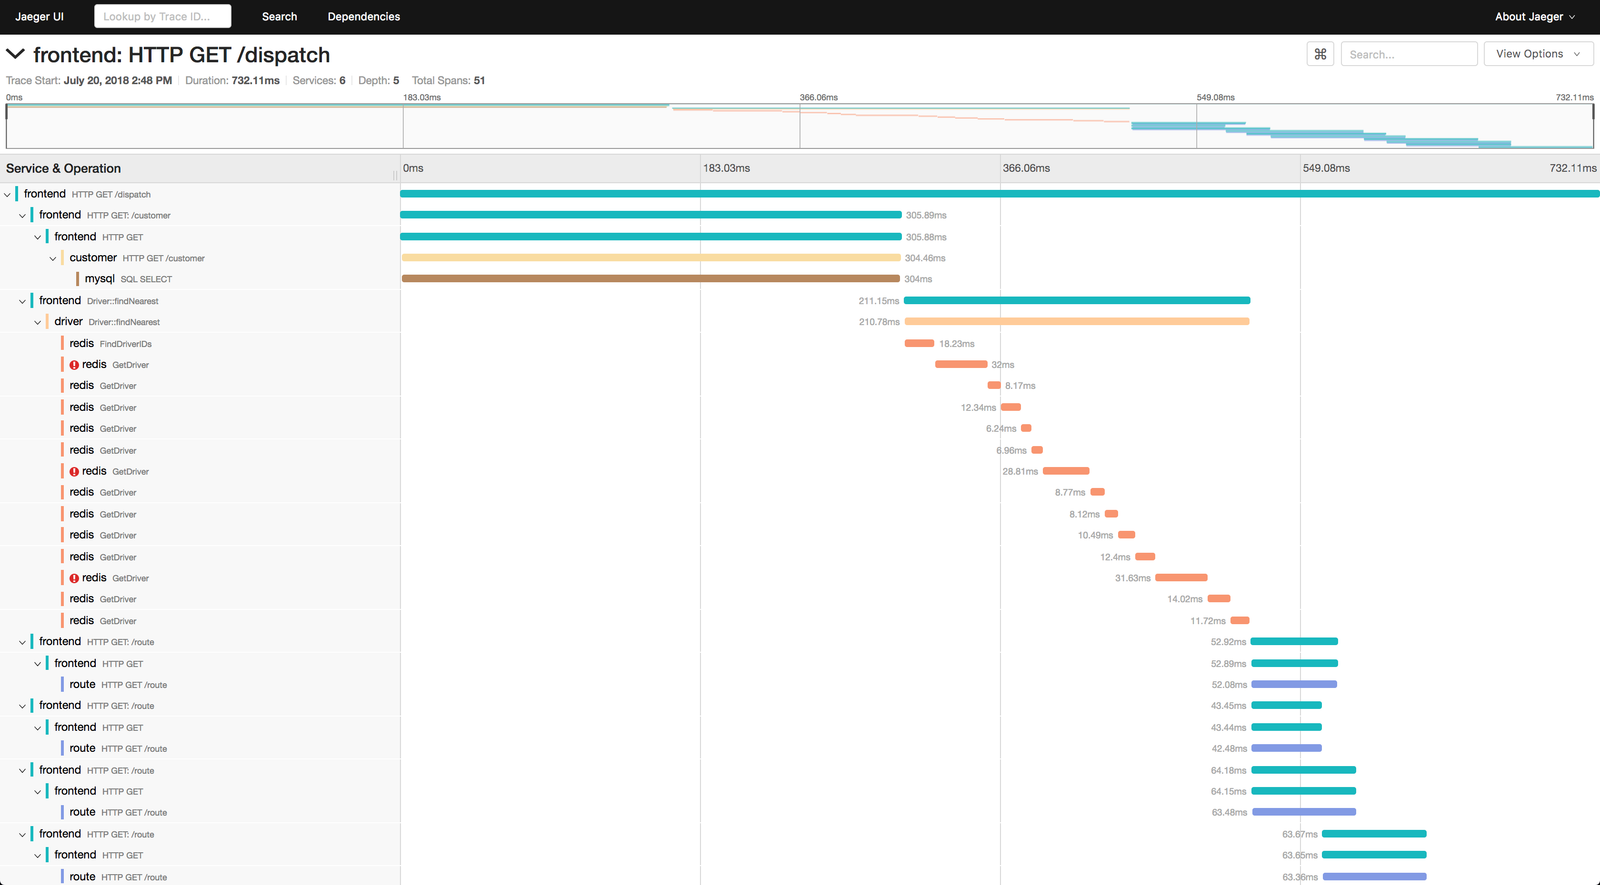
Instrument where ownership changes: application to gateway, orchestrator to agent worker, worker to tool service and local agent to external agent. A span name should describe an operation, not include user text or dynamically generated tool arguments. Resource attributes identify service, deployment and region; span attributes identify this operation. Keep agent role distinct from service name because several agents may run in one process and one logical agent may execute across services.
The A2A specification defines interactions for agent-to-agent tasks, messages and artifacts. When tracing such exchanges, record local task and context identifiers, remote agent identity, protocol operation and terminal state. Treat remote traces as independently governed. Link their task reference when permitted, but do not assume shared sampling, retention or payload policy. A handoff is successful only when the receiving side accepts the work and the sending workflow updates ownership.
Choose attributes for diagnosis and metrics
Use low-cardinality attributes for model provider, model family, operation, agent role, tool name, policy version, risk tier, error category and final disposition. Put token usage, retry count and evaluation score in numeric fields. High-cardinality identifiers such as workflow run ID belong in traces but should not become metric labels. Events can mark retrieval completion, guardrail result, approval request, context compaction or fallback. Each event should carry machine-readable reason codes rather than prose alone.
| Signal | Likely question | Useful segmentation | Owned response |
|---|---|---|---|
| Workflow latency | Where does user-visible delay accumulate? | Step, tool, model and queue | Tune, cache or change timeout |
| Fallback rate | Is a provider or route unstable? | Primary route and error class | Open circuit or investigate policy |
| Tool rejection | Are arguments, permissions or state wrong? | Tool, rule and agent version | Fix contract or authority context |
| Handoff depth | Are agents looping or overspecialized? | Role path and intent | Change orchestration |
| Approval wait | Is review capacity blocking outcomes? | Risk tier and queue | Adjust staffing or decision packet |
| Outcome failure | Did a technically complete run solve the task? | Workflow and scenario class | Evaluate trajectory and product design |
Make trace privacy a design constraint
Prompts, completions and tool arguments can contain personal data, credentials, confidential documents and security details. Default to metadata and governed references. If payload capture is necessary for evaluation or incident response, apply purpose-specific sampling, field redaction, tenant isolation, short retention and restricted access. Redact before export, because downstream collector filters cannot retract data already transmitted. Never place secrets in span attributes or baggage, which may propagate widely.
The NIST Privacy Framework helps organizations identify and manage privacy risk through enterprise risk management. Apply data processing maps to the telemetry path: instrumentation library, collector, processor, exporter, backend, support access and deletion. Record policy version and capture mode so investigators know whether a missing payload was intentionally excluded. Privacy-preserving observability is not incomplete observability; it is a deliberate shift toward state, reason and correlation evidence.
Sample by risk and preserve tail evidence
Head sampling decides early and is inexpensive, but it cannot know which runs will fail. Tail sampling can retain errors, long latency, fallbacks, policy denials and high-risk actions after observing the trace. Combine a small representative baseline with rules for consequential and anomalous outcomes. Sampling decisions should propagate consistently within a workflow. Record aggregate counters outside traces so operators still know total volume and error rates when individual traces are dropped.
Set retention by data class and purpose. Operational metadata may justify a longer window than captured content. Approval and audit evidence may have separate legal retention from debugging traces. Avoid using the telemetry backend as the system of record for business actions; link to authoritative audit records. The audit logs checklist helps distinguish durable evidence from diagnostic events.
Build SLOs around completed agent work
Define indicators such as the proportion of eligible workflows that reach an acceptable terminal state within a time window, or consequential proposals that include complete approval evidence. Model-call availability is a dependency indicator, not the user promise. Budget errors by cause: model failure, tool failure, policy rejection, user abandonment and incorrect outcome require different responses. Use exemplars to jump from a metric anomaly to a representative trace without putting trace IDs into every metric label.
Alert only on conditions with an owner and playbook. A rising model latency page may be actionable to the platform team; a quality drift alert may need an evaluation owner and can operate on a slower window. The LLM observability implementation checklist covers broader rollout, while the model observability guide joins traces to evaluations, cost and review. Agent tracing supplies the causal spine for both.
Roll out instrumentation as a versioned contract
Publish a semantic dictionary for span names, required attributes, reason codes and privacy modes. Test instrumentation with golden traces that cover success, tool failure, handoff, approval and cancellation. Validate parentage, links, timestamps and redaction before production. Introduce collector limits and backpressure so telemetry failure cannot exhaust the agent service. Decide whether exporters drop, buffer or block, and keep the default from changing the business transaction.
Version custom conventions and map them to OpenTelemetry as standards evolve. Avoid dashboards that depend on undocumented attribute spelling. Assign ownership for libraries, collectors, schemas and alerts. Periodically run a trace reconstruction exercise: give an operator a failed workflow and verify that they can identify the failing dependency, policy decision, user outcome and next action without privileged database access. That is the practical test of observability.
Key takeaways
- Anchor traces to bounded business workflow attempts, not arbitrary chat sessions.
- Use workflow, agent, model, tool, handoff, approval and outcome spans with stable semantics.
- Represent asynchronous and external-agent continuations with links where parentage would mislead.
- Default to metadata and governed references; capture content only for a justified purpose.
- Combine representative and tail sampling while preserving aggregate metrics.
- Tie alerts and SLOs to completed useful work and named operational responses.
Frequently asked questions
Should prompts and completions be stored in every trace? No. Metadata, hashes and source references often provide enough diagnosis. Capture bodies selectively under a separate privacy and retention policy.
Is one trace the same as one conversation? Usually not. A trace should represent a bounded operation. Related workflow traces can share a conversation or group reference without creating an indefinitely long trace.
Can vendor-native traces coexist with OpenTelemetry? Yes. Use processors or adapters to export common semantics, preserve vendor-specific details in namespaced fields and test that correlation and redaction remain correct.
Conclusion
OpenTelemetry AI agent tracing works when it models causality, ownership and outcomes instead of accumulating prompt logs. Establish a workflow trace spine, preserve service and agent boundaries, use common semantic attributes, protect sensitive content and sample for both representation and failure. Then connect traces to SLOs, evaluations and durable action records. Operators gain a coherent account of how models, tools and people produced a business result, with enough evidence to improve the system without turning observability into a new privacy risk.