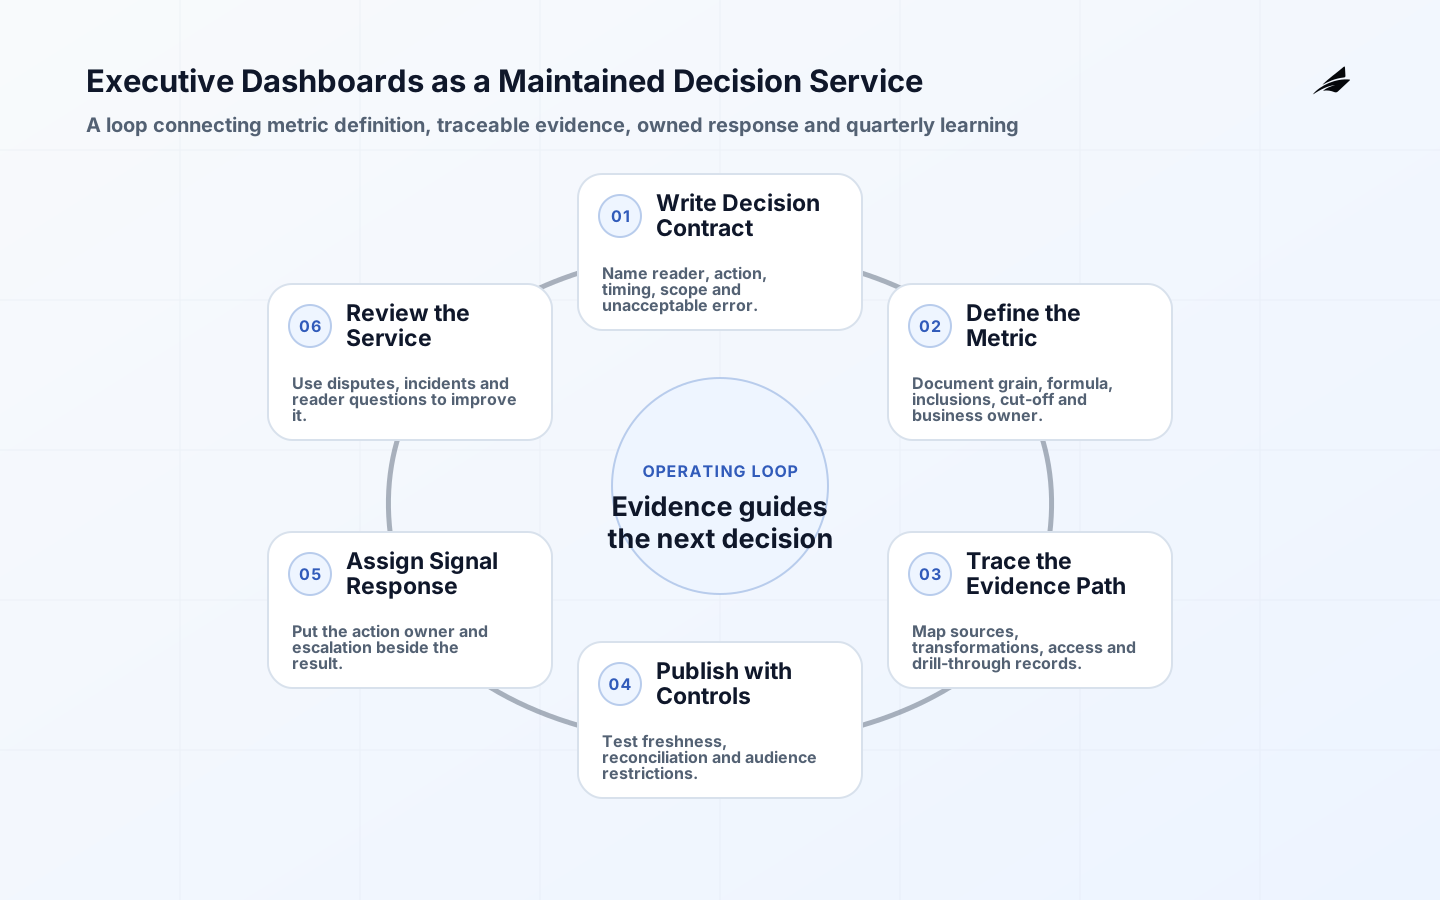
Executive dashboards should compress a decision, not compress every available chart. IT managers can raise their value by asking what an executive will do differently when a measure crosses a threshold. That question exposes the necessary context: the owner, period, population, comparison baseline, freshness, and drill route. A revenue chart without booking rules can create a long meeting and no decision. A concise view that shows the approved measure, material variance, and accountable action can reduce preparation work without pretending that uncertainty has disappeared. Start with a recurring meeting where a real decision already occurs and build for that cadence.
Define the decision before expanding executive dashboards
The first boundary for executive dashboards is the decision contract: who uses the result, what action they can take, when they need it, and what error is unacceptable. Turn that statement into a short review artifact with an accountable business owner and a technical owner. It should state the population, time basis, authoritative source, material exclusions, and a route for exceptions. This prevents a broad platform initiative from claiming success because it produced data, while the intended reader still relies on a spreadsheet or private interpretation. A narrow, repeated decision is the best starting point because it forces the team to make terms and handoffs concrete.
- Name the operator or leader who will change an outcome after seeing executive dashboards.
- Describe the population and time rule in plain language, including exclusions.
- Identify the source or record that is authoritative when systems disagree.
- Set a freshness or review window that matches the action rather than a generic technical target.
- Write the fallback and escalation path for missing, contradictory, or restricted data.
Make executive dashboards evidence inspectable
Separate presentation from definition. A visual may use different filters and layouts for different audiences, but the core metric needs one documented calculation and accountable source. The Power BI guidance is a useful implementation reference because it emphasizes planning, adoption, governance, and administration alongside report design. Define refresh expectations and status explicitly. “Daily” can mean an overnight snapshot, a rolling 24-hour interval, or a refresh that happened whenever an upstream system completed; readers should never have to infer which one applies.
| Design area | Decision to make | Evidence to keep |
|---|---|---|
| Executive question | Required context | Example action |
| Are we on plan? | Approved target, period, and scope | Reprioritize investment or investigate variance |
| Where is service at risk? | Threshold, queue owner, and freshness | Assign capacity or remove a blocker |
| What changed? | Baseline, definition version, and drill route | Validate a shift before changing policy |
Build an operating path for executive dashboards
Build a governed route from source to executive view. Map source systems, transformations, metric logic, access roles, and the table or record that explains a surprising total. Apply row-level restrictions where audience scope differs, and test that a drill-through does not broaden access unintentionally. Keep an approved fallback for a late source: hold the tile, label it stale, or publish a qualified prior period. A dashboard that silently swaps in an old number is worse than an unavailable tile because it makes a decision appear evidence-based when it is not.

Set controls and responses for executive dashboards
Controls should test a declared promise and lead to a known response. For executive dashboards, combine preventive controls, such as controlled schemas or access roles, with detective controls, such as reconciliation, freshness checks, and review of unexpected distributions. Do not make every deviation an incident; define materiality so teams can separate a correctable record from a decision-threatening condition. Each alert or review should identify the owner, affected scope, evidence available, containment choice, and communication expectation. The result is a service that can explain its limitations under pressure, not just a successful scheduled job.
| Control moment | Question | Expected response |
|---|---|---|
| Dashboard condition | Visible treatment | Owner action |
| Source late | Mark tile stale with last successful refresh | Investigate source and decide whether to defer review |
| Definition changed | Show effective date and comparison limit | Notify dependent leaders and update the metric record |
| Access request | Apply role and scope review | Grant least privilege and log approval |
Work through a real executive dashboards case
A regional executive sees a sharp increase in open support cases and asks for a staffing decision. The dashboard should distinguish cases created this week from aged backlog, show the service definition, and link to the queue owner. During investigation, the team finds that a routing change created duplicate cases for a single customer request. The best response is to qualify the chart, give the current count with a duplicate warning, and trace the issue to its source. After correction, the team adds a duplicate-rate control and documents how historical periods were treated.
Govern change and access in executive dashboards
Operate the dashboard as a shared service. Review who has access, record metric definition changes, and remove pages that no longer support a decision. Page views alone are not adoption. Look for shorter meeting preparation, fewer conflicting spreadsheets, faster resolution of exceptions, and the ability of a reader to trace a number to its evidence. The BI dashboards guide offers a useful next step for teams turning a single executive review into a reliable decision loop.
Measure whether executive dashboards improves the work
Measure executive dashboards through the quality of the decision path, not implementation activity alone. Useful signals include time from a material signal to a documented response, recurring disputes over a definition, percentage of decisions supported by current evidence, unresolved exceptions, and the number of parallel workarounds. Compare these with a baseline, then ask users to explain a representative result and what they would do if its main input were delayed. A higher dashboard view count or a larger catalog may be encouraging, but neither proves that decisions became more reliable. Revisit the measure when the workflow, source system, or ownership model changes.
Run the first 90 days of executive dashboards deliberately
In the first month, choose one high-value workflow and establish its baseline: current preparation time, exception rate, decision delay, and the manual reconciliation that people perform today. In the second month, release the smallest complete executive dashboards path to the people who already do that work. Include source status, an owner, a drill route, and a log for disputed cases; do not add broad self-service until these basics survive ordinary use. In the third month, review a sample of normal decisions, difficult exceptions, and a controlled failure such as a late input or a definition change. Record what the team learned, remove a workaround only after the replacement is reliable, and decide whether the same pattern is ready for a second domain. This sequence makes investment visible without rewarding superficial rollout activity.
Review the executive dashboards operating system
A quarterly review keeps executive dashboards aligned with the work rather than the original project plan. Bring together the business owner, source owner, technical operator, and a regular reader. Examine the most consequential incident, the most common reader question, meaningful changes to source scope or policy, access exceptions, and measures that no longer lead to action. Verify that contact details and runbooks still work, that failed checks retain enough evidence for investigation, and that historical comparisons carry the right definition label. Decide explicitly whether to tighten a promise, accept a bounded limitation, automate a repeated check, or retire a stale output. The review should leave a short record of decisions and owners, so the next change starts with context instead of rediscovery.
Make the next executive dashboards decision easier
Use the review to remove friction for the next person who needs executive dashboards. Add a concise definition where a reader hesitated, preserve a representative failing record where an incident was difficult to reproduce, and put the owner or escalation contact beside the output that needs it. When a workaround has become routine, decide whether it represents a missing product feature, an unavoidable control, or a path that should be retired. This small discipline prevents institutional knowledge from living only in chat messages and meeting memory. It also makes scale more realistic: a new team can adopt an established decision pattern with its boundaries, evidence, and response practice already visible.
Key takeaways for executive dashboards
- Start executive dashboards with a real decision, named owner, and explicit time requirement.
- Make source authority, definitions, scope, and limitations visible near the result.
- Test declared promises at the source, transformation, and publication points.
- Treat exceptions, late data, and semantic changes as design cases rather than edge cases.
- Use incidents and reader questions to improve the next release instead of accumulating undocumented workarounds.
Frequently asked questions about executive dashboards
Who owns executive dashboards? Ownership is shared but not vague: a business owner approves the decision meaning, source owners protect captured facts, and technical owners operate the path and controls. How broad should a first release be? Make it narrow enough to test in one working cadence, but complete enough to include authority, quality checks, access, and an exception route. When should a definition change? Change it when the business meaning genuinely changes; version the rule, compare results where practical, and tell affected readers the effective date. What should happen when data is late? Show the status, follow the agreed fallback or hold rule, and investigate the cause instead of presenting a silently stale answer.
Conclusion: make executive dashboards a maintained decision capability
IT Managers get the greatest return from executive dashboards when they build it as a maintained capability: a bounded decision, inspectable evidence, explicit controls, a response owner, and a learning loop. Begin with the path that is already causing friction, document its promises, and prove the workflow with ordinary and difficult cases. Then expand only after the team can explain a result, recover from a known failure, and show that the decision improved. That approach keeps technical ambition connected to the people, records, and consequences that make the data worth trusting.