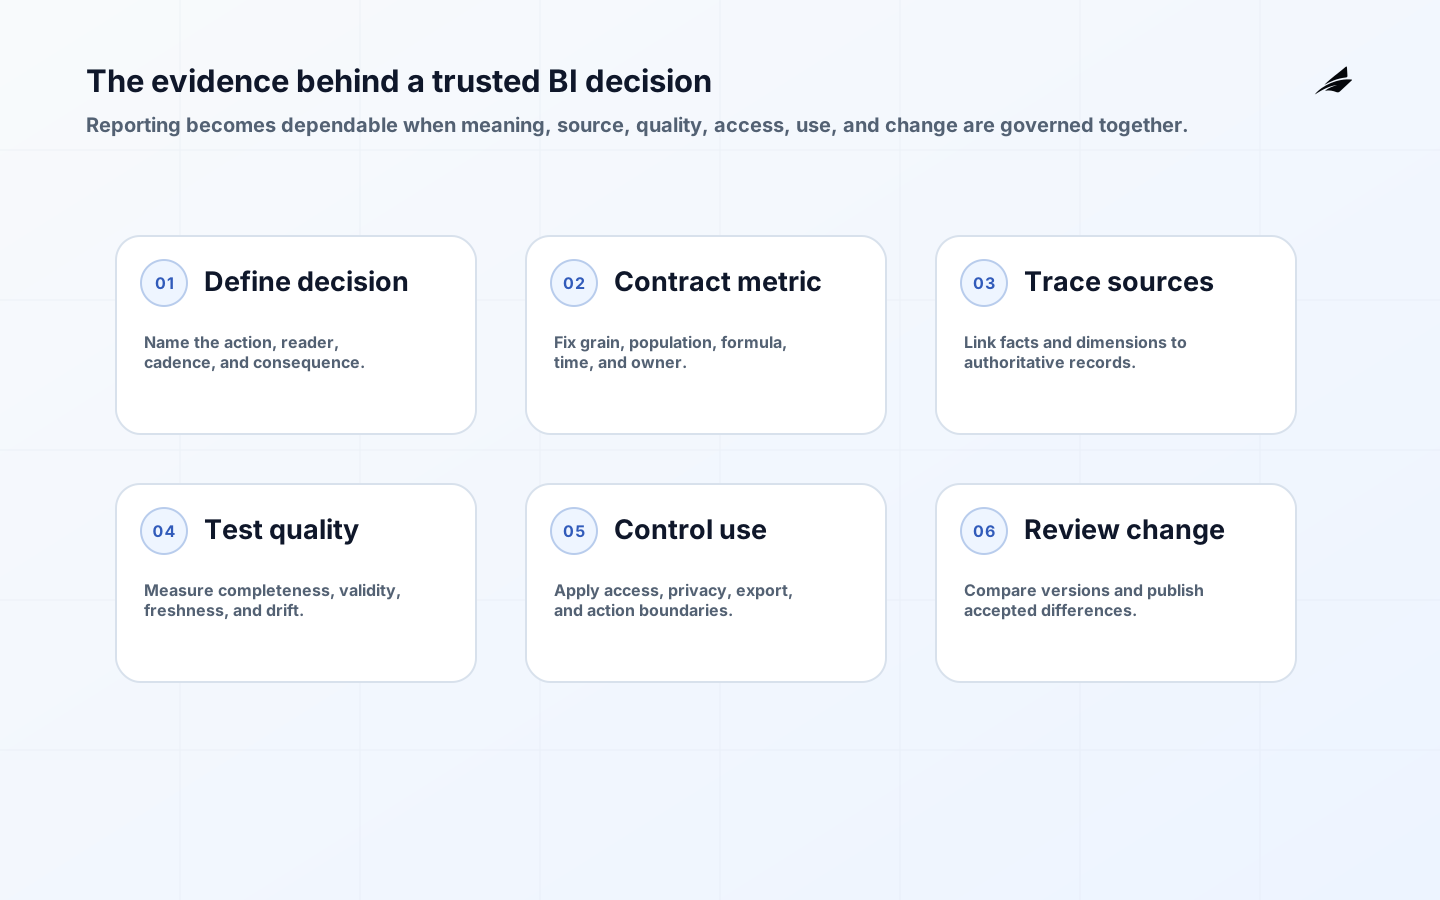
Business intelligence means more than charts, dashboards, or a particular analytics platform. It is the operating system that turns records from business activity into definitions, comparisons, explanations, and decisions that can be repeated. A BI result is trustworthy when a reader can tell what population it covers, which event it measures, whose definition applies, when the data was refreshed, and what action the result supports. Without that chain, a polished dashboard can accelerate disagreement instead of insight. The right starting point is therefore a decision and a metric contract, not a visual. The contract makes the grain, denominator, time rule, exclusions, owner, and permitted uses explicit before transformation logic becomes difficult to change.
What business intelligence means in an operating context
Business intelligence combines the collection, preparation, presentation, and interpretation of information for management or operational decisions. It is not synonymous with a data warehouse, self-service analytics, artificial intelligence, or a spreadsheet. Those can contribute, but the central unit is a decision supported by data that is fit for that purpose. A service manager may need a weekly view of overdue cases and their owner. A finance lead may need a reconciled measure of billed revenue. Each requires different freshness, completeness, access, and evidence. Treating both as generic analytics produces vague requirements and makes later disputes difficult to resolve.
Start with a metric contract
For every important measure, write a compact contract: the business question, name, formula, grain, inclusion and exclusion rules, owner, source system, refresh expectation, display format, and known limitations. Define time carefully. A measure based on when a case was created answers a different question from one based on when it was completed, and both may differ from the accounting period. Include the expected action when the metric changes. A report that tells a team to investigate a queue needs a case-level drill-through and clear assignment; a board measure may only need a trend and explanatory note. The contract is the shared object that makes changes reviewable.

Identify the authoritative source before transforming data
A report can combine many systems, but it should not blur which system has authority for each fact. Identify the system that owns a customer status, contract value, staffing allocation, or case closure, then describe how updates arrive and how conflicts are resolved. When a dashboard displays a derived value, preserve enough lineage to trace it back through the transformation and source. The W3C PROV model is useful conceptually: distinguish the entity being shown, the activity that produced it, and the agent accountable for that activity. This does not require adopting a formal ontology. It requires records that let a capable person explain why a number has the value it has.
Design data quality controls around decision harm
Do not count nulls and duplicates merely because they are easy to count. Identify the failures that would lead a reader to take the wrong action: a delayed feed that hides recent work, duplicate accounts that inflate demand, an unapproved mapping that changes a segment, or a missing currency conversion that distorts comparison. Set tests at ingestion and transformation, record their result, and expose the material limitations near the decision. A freshness badge is useful only when its expected time and failure threshold are defined. If data is late, decide whether the report should show a warning, use a last-known value, or be withheld. The decision is a governance rule, not a visual preference.
Control access at the data and action boundary
A report that combines operational records can reveal more than any source system showed separately. Plan roles, row or tenant scope, export permissions, and audit events before opening self-service access. Separate the ability to view an aggregate from the ability to inspect an individual record or download a population. Security controls should also cover metric changes: an analyst may propose an amendment, but the owner of the business definition should approve it before a published report silently changes. This is particularly important for recurring executive or regulatory reporting, where a historical trend needs a disclosed restatement rather than a rewritten past.
Choose a delivery pattern that matches the reader
| Reader need | Useful pattern | Required evidence |
|---|---|---|
| Daily exception work | Queue with named owner, priority, and drill-through. | Currentness, assignment, and record-level trace. |
| Management review | Trend, comparison, and defined decision threshold. | Stable metric contract and explanation of variance. |
| Financial control | Reconciled statement with period close discipline. | Source tie-out, approvals, and retained version. |
| Exploration | Governed semantic model with constrained dimensions. | Access scope, definition catalogue, and query audit. |
The same data can serve more than one pattern, but forcing every reader into a large dashboard is usually counterproductive. Operators need a short path from signal to action. Leaders need comparable measures and context. Analysts need sanctioned dimensions and an ability to test a question without publishing a private calculation as fact. Publish the smallest useful view first, then observe what decisions it changes. Retire reports that produce no action or duplicate a controlled measure. Business intelligence earns trust when it reduces the effort needed to reach an accountable decision.
Run a visible review and change cycle
| Review question | Check | Outcome |
|---|---|---|
| Is it still used? | Observe the meeting or workflow it supports. | Retire, simplify, or retain intentionally. |
| Is it still correct? | Reconcile a sample to source records. | Fix lineage, mapping, or documentation. |
| Is it still safe? | Review readers, exports, and sensitive fields. | Adjust roles or masking. |
| Has the meaning changed? | Review proposed metric amendments with the owner. | Version, annotate, and communicate the change. |
Make a metric change reviewable before it reaches a dashboard
A durable semantic model separates business events from the dimensions used to filter and explain them. Microsoft's star schema guidance describes facts for summarization and dimensions for filtering and grouping, including the consequences of slowly changing dimensions. Quality needs an equally explicit vocabulary: the W3C Data Quality Vocabulary supports measured quality metadata, while W3C PROV represents how data was produced. Platform operation matters too; Microsoft's tenant auditing guidance shows why usage and administrative activity deserve their own governed model. Apply the NIST Privacy Framework when analytical usefulness must be balanced against privacy risk.
| Metric contract field | Why it matters | Example evidence |
|---|---|---|
| Grain | Prevents mixing events, snapshots, and entities | One row per paid invoice line |
| Population | Makes inclusion and exclusion reviewable | Eligible accounts and excluded test tenants |
| Time rule | Explains period and lateness behavior | Event time, timezone, close window |
| Owner | Names who accepts meaning and changes | Business steward and technical custodian |
Version every material metric definition and record why it changed. A revised cancellation rule, currency conversion, late-arriving event treatment, or customer classification can alter history even when the chart is unchanged. Before release, calculate old and new logic over a representative period, quantify who and what moves, and ask the business owner to accept the effect. Publish the definition, effective date, known limitations, and a reconciliation view for material differences. Preserve the old result long enough to explain decisions made under it. When a source corrects prior records, distinguish a source-data correction from a definition change. This discipline gives finance, operations, and product teams one place to challenge a number and prevents silent semantic drift from becoming a recurring meeting ritual.
Related implementation guidance
Edilec's system-of-record checklist helps identify where facts originate. The admin panel versus dashboard guide separates observation from operational action, while the zero-trust reporting checklist extends access decisions into analytical delivery.
Implementation notes for business intelligence meaning
Metric design needs a deliberate reconciliation point. For a measure that affects financial, contractual, or service commitments, choose a source-period sample and compare report output against the underlying records. Investigate every material difference: a late event, excluded state, duplicated identity, changed mapping, or rounding convention may be legitimate, but it must be explained. Preserve the reconciliation result and the version of the metric contract used. This prevents a dashboard from becoming a parallel accounting system whose numbers cannot be defended.
Self-service should be earned, not assumed. Give analysts an approved semantic model with clear dimensions, controlled joins, and an accessible definition catalogue. Let them explore questions while separating personal analysis from published organisational measures. A promotion path should require a named owner, peer review of the calculation, data-quality checks, and communication to affected readers. That balance avoids both extremes: a central team that bottlenecks every question and an uncontrolled landscape of reports that use the same label for different logic.
Key takeaways
- Business intelligence is a route to a decision, not a collection of visualisations.
- Give every material metric an owner, definition, source, and time basis.
- Preserve lineage and test the failures that would cause harmful action.
- Review usage, correctness, access, and metric changes as normal operations.
Frequently asked questions
- Does BI require a data warehouse? No. A durable model may help, but the first requirement is a governed decision and reliable data path.
- What is a semantic layer? It is a managed representation of business concepts and metrics that keeps reporting logic consistent across tools.
- Who owns a metric? The business owner is accountable for its meaning; technical owners are accountable for the controlled implementation and operation.
Operating review considerations
For reporting teams, governance becomes practical in the release calendar. Set a review date for every material report, confirm that the owner still recognises its decision, and sample the displayed values against source records. When a definition changes, publish the effective date and explain whether historic periods were recalculated or retained under the old rule. Keep a short issue register for freshness failures, access questions, and reconciliation breaks. This provides a disciplined alternative to the familiar cycle in which a dashboard loses trust, is rebuilt under a new name, and eventually accumulates the same undocumented assumptions.
Finally, distinguish operational monitoring from performance interpretation. Pipeline alerts, failed tests, and late refreshes tell the data team whether the reporting service is running. They do not by themselves explain why sales, service quality, or demand changed. Keep the technical service measures alongside, but separate from, the business measures so readers can investigate each question with the right evidence and owner.
Conclusion
Business intelligence becomes useful when a team can explain the decision, the metric, the source, the transformation, and the owner without hand-waving. Build that evidence path before expanding dashboards, and reporting becomes a dependable part of operations rather than another place for competing numbers.