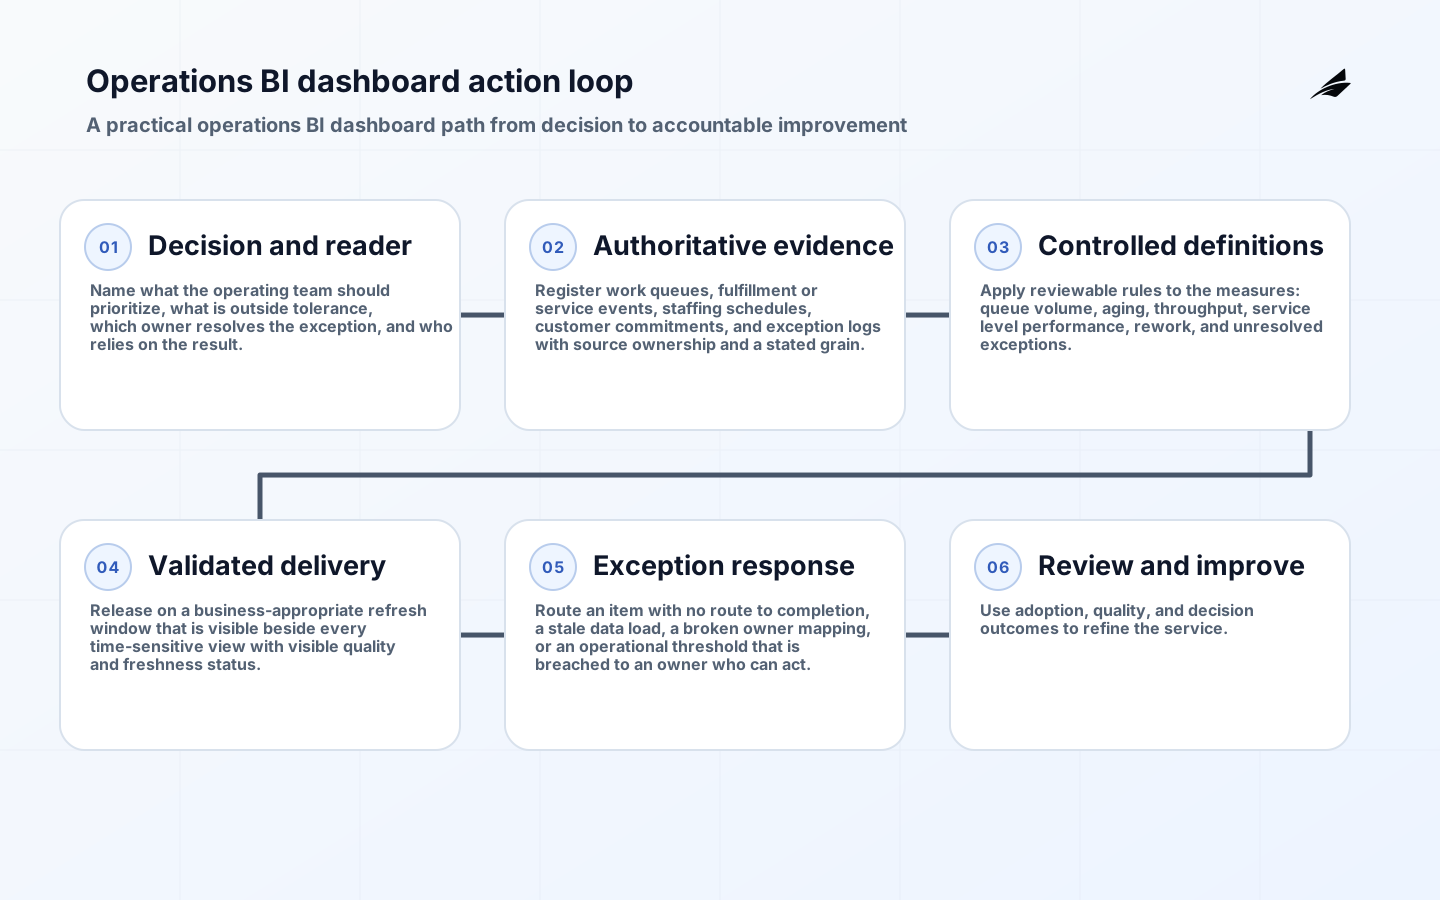
Operations BI Dashboard Planning: From Questions to Daily Action starts with a delivery decision, not a preferred chart or platform. The purpose is to help operations leaders plan a dashboard that supports a recurring management rhythm decide what the operating team should prioritize today, what is outside tolerance, and which owner must resolve the exception. That scope changes the work. Instead of gathering every available field, the team defines the action, evidence, timing, and responsibility that make a number useful. A polished report that cannot explain its source, freshness, or owner creates false confidence. A smaller, well-run information service makes uncertainty visible and gives people a reliable next move.
Define the decision BI dashboards for operations must support
Write the decision in a sentence a working team can challenge: “At this review, the operations manager running the daily operating review will use this view to decide what the operating team should prioritize today, what is outside tolerance, and which owner must resolve the exception.” The sentence establishes the audience, the operating moment, and the standard for inclusion. A weekly planning pack should not quietly become a live control room, and a daily work queue should not pretend to be a period-close statement. Ask readers which action they would take when a measure moves, what evidence would change that action, and what they need when the evidence is incomplete.
- Name the operations manager running the daily operating review as the accountable reader and identify the meeting, queue, or workflow where the view will be used.
- State the action the reader can take: assign work, remove a blocker, change the daily plan, or escalate a persistent constraint.
- Separate decisions that need current operational detail from decisions that need reviewed historical totals.
- Record the consequence of using stale, incomplete, or disputed information before agreeing a refresh target.
- Keep an investigation path available, while leaving the first screen focused on the immediate decision.
Set a practical service contract
BI dashboards for operations need an operating contract before anyone builds an extract or chooses a visualization. The contract is a short shared record of purpose, scope, authority, delivery timing, access, and recovery. It should say that the intended record set is work queues, fulfillment or service events, staffing schedules, customer commitments, and exception logs; it should also state what is deliberately excluded. Define freshness as a business-appropriate refresh window that is visible beside every time-sensitive view. That is more useful than promising “live” information because it gives readers a way to decide whether the current result is safe for the decision at hand.
| Contract element | Question to settle | Evidence to retain |
|---|---|---|
| Decision boundary | What decision does BI dashboards for operations influence? | Named reader, operating moment, and expected action: assign work, remove a blocker, change the daily plan, or escalate a persistent constraint. |
| Record authority | Which system and fields are authoritative? | A source register covering work queues, fulfillment or service events, staffing schedules, customer commitments, and exception logs. |
| Freshness and release | When is the view safe to use? | a business-appropriate refresh window that is visible beside every time-sensitive view |
| Access and recovery | Who can use it and who resolves a failure? | Role rule, the operations manager running the daily operating review, and an exception route for an item with no route to completion, a stale data load, a broken owner mapping, or an operational threshold that is breached. |
Map the evidence and choose a defensible grain
The most consequential design choice is often the grain: the real-world thing represented by one row before aggregation. For this service, use one operating item at its current state, with enough history to explain how it reached that state. A grain statement prevents accidental mixing of snapshots, events, and summaries. It also exposes whether two systems describe the same entity using incompatible identifiers. Maintain a source register with an owner, primary key, arrival expectation, permitted use, and a note about corrections. When a source changes, the register gives the team a concrete impact list instead of an anxious search through dashboards.
- Keep the source identifier and the time the record was observed whenever the information may later be corrected.
- Distinguish event time, effective time, and load time; they answer different questions during an investigation.
- Use a controlled crosswalk for identities, territories, accounts, products, or other shared reference values.
- Treat a manually maintained mapping as a governed record with an owner, review date, and change history.
- Do not use a calculated display total as the only source of truth for a more detailed measure.
Define measures, thresholds, and interpretation
Readers need more than a label and a decimal. The useful measure set for this guide includes queue volume, aging, throughput, service level performance, rework, and unresolved exceptions. For every material measure, document the business question, numerator, denominator where applicable, inclusion and exclusion rules, time window, grain, owner, and known limitations. Define a threshold only when it changes the expected response. A red status without a route to action is decoration; an unexplained variance can be more important than a number that merely missed a target. Keep targets, plans, and historical comparisons clearly separated.
| Measure component | Planning question | Control that prevents misunderstanding |
|---|---|---|
| Business meaning | What operating condition does this measure describe? | A plain-language definition reviewed by the accountable reader. |
| Calculation | Which records count and which do not? | Versioned calculation logic and a small set of worked examples. |
| Comparison | What is the reference point? | Label the target, forecast, plan, prior period, or peer group explicitly. |
| Response | What happens outside tolerance? | A named route for an item with no route to completion, a stale data load, a broken owner mapping, or an operational threshold that is breached. |
Design a controlled data path
A dependable delivery path separates source intake, transformation, semantic definition, and reader experience. It does not require an elaborate platform at the outset; it requires traceability. A person investigating a number should be able to answer where it originated, which rule shaped it, when the rule last ran, and whether quality checks passed. Preserve raw evidence where retention rules permit, make transformations reviewable, and publish reusable definitions rather than embedding business logic separately in each report. In daily operations, this path must expose the current work state and the owner of the next intervention without hiding the history that explains a delay.

Plan the path around failure as well as normal flow. An item with no route to completion, a stale data load, a broken owner mapping, or an operational threshold that is breached is not an edge case to hide in a runbook after launch; it is part of the reader experience. Decide whether the view should show a warning, hold its previous approved result, suppress an unsafe measure, or stop publication. The answer depends on the decision and the risk of a wrong number. Publish a visible last-successful time and give the designated owner enough diagnostic detail to act without asking readers to interpret technical logs.
Validate before release and after change
Validation combines automated checks with business review. Automated checks can detect a missing file, unexpected schema, duplicate key, null required field, impossible date, or reconciliation difference. They cannot decide whether a new result makes business sense in context. Before release, compare a small sample to source records, run agreed reconciliation totals, and ask a reader to follow the decision path using a realistic exception. After a source or definition changes, repeat the checks that prove the affected measure still means what its label says. For an operations dashboard, test the queue totals and aging bands against the active work system, then walk through a delayed item with the daily-review owner.
- Check that the delivered row grain remains one operating item at its current state, with enough history to explain how it reached that state.
- Test completeness, uniqueness, validity, timeliness, and reconciliation against a named control total.
- Retain a release record: input period, rule version, run time, result, approver when required, and exception status.
- Escalate an item with no route to completion, a stale data load, a broken owner mapping, or an operational threshold that is breached through the agreed owner rather than repairing a published number silently.
- Use a controlled correction note when a released result changes, so readers can understand the scope and timing.
Make the reader experience actionable
The delivery surface should answer the primary decision quickly, then support investigation without turning every reader into an analyst. Put the operating status, comparison point, freshness, and material exceptions where they can be scanned together. Make filters intentional and show their effect on the population. Provide a route from a summary to the accountable underlying items, but avoid presenting sensitive detail to readers who only need an aggregate. Most importantly, attach every exception to a realistic response: assign work, remove a blocker, change the daily plan, or escalate a persistent constraint.
Run adoption and review as an operating practice
Launch is the beginning of the service, not proof that it works. Observe whether the intended readers return at the operating moment, whether exceptions are resolved, and whether people create side spreadsheets because a needed definition or drill path is missing. Review changes in source systems, organization, access needs, and decision cadence. The operations manager running the daily operating review should own the business usefulness of the view, while technical owners maintain the delivery controls. A regular review makes retirement possible too: information nobody uses or trusts should not continue to consume attention.
Key takeaways
- BI dashboards for operations are valuable only when it supports a named decision and a concrete action.
- Start from work queues, fulfillment or service events, staffing schedules, customer commitments, and exception logs, but document which records are authoritative and how their identities connect.
- Use a business-appropriate refresh window that is visible beside every time-sensitive view; make freshness and failure status visible to readers.
- Design for an item with no route to completion, a stale data load, a broken owner mapping, or an operational threshold that is breached before it occurs, including who is allowed to release or correct information.
- Treat definitions, checks, access, and change review as parts of the delivered service, not paperwork around it.
Frequently asked questions
What should the first BI dashboards for operations release contain?
Start with one high-value decision, the smallest reliable record set, a handful of measures, and an exception route. Include the definition, freshness indicator, source owner, and a path to investigate the underlying items. Delay secondary views until the first release is used in a real operating rhythm. This sequence lets the team learn whether the decision statement and action route are right before creating a large reporting estate that is difficult to govern. Begin with the daily prioritization board for one operational unit and verify that each flagged item has an owner and a usable next step.
How often should it refresh?
Set the interval from the decision deadline and the source behavior, not from a default tool setting. In this case, plan for a business-appropriate refresh window that is visible beside every time-sensitive view. A fast refresh is not automatically better: it can increase load, expose partial data, and encourage readers to react to noise. State the last successful update, distinguish a completed delivery from a visual refresh, and choose a clear response when the expected update is late.
Who owns a disputed number?
Ownership is shared but should never be vague. The source owner is accountable for the originating record; the definition owner is accountable for the calculation and its documentation; the delivery owner is accountable for the run and access; and the operations manager running the daily operating review is accountable for deciding how the information is used. Route disputes to the smallest owner group that can resolve them, record the conclusion, and communicate a correction when a published result materially changes.
Conclusion
A useful BI dashboards for operations plan creates a trustworthy route from evidence to action. Define the decision, establish the data and delivery contract, control the transformations, test the measures, and make exceptions visible to the people who can resolve them. That discipline gives operations leaders planning a dashboard that supports a recurring management rhythm something better than a busy dashboard: a service they can use with appropriate confidence, improve over time, and explain when a client, colleague, or leader asks how a result was produced.