Operations BI Dashboard: A Launch Checklist for Day One begins with a working decision, not a tool selection. The launch manager, operations lead, support lead, and product owner needs to know whether launch operations are healthy, which customer or workflow issue needs priority, and when the team should change the launch plan. That is the standard for every field, calculation, and screen in this guide. Start by writing the operating moment in plain language: who looks, what they can change, how quickly they need evidence, and what could go wrong if the evidence is late or incomplete. BI dashboards for operations is dependable when readers can see its scope, source, freshness, and owner without having to reconstruct the logic from a report.
Define the decision BI dashboards for operations must support
Interview the intended readers in the place where the decision is actually made. Ask for the last difficult case, the evidence they trusted, and the action they took. For this work, the decisive question is whether launch operations are healthy, which customer or workflow issue needs priority, and when the team should change the launch plan. A requirement such as “show performance” is too broad to test; a decision statement establishes a boundary for the first release. It also prevents one view from trying to serve executives, operators, and analysts with incompatible levels of detail. Keep an investigation path available, but make the opening view answer the immediate question.
- Name the accountable reader and the meeting, queue, or handoff where BI dashboards for operations will be used.
- Write the action that follows a material change and the person authorized to take it.
- State the decision horizon: what must be known now, this week, or at period close.
- Record the consequence of stale or disputed evidence before setting a refresh expectation.
- Separate the reader’s first action from exploratory questions that need a deeper workspace.
Set a compact operating contract
Before development, turn the decision into a short service contract. For BI dashboards for operations, the evidence is product events, orders or requests, support contacts, fulfillment status, incident records, and launch capacity. The expected grain is one launch event, customer journey step, order, or support case with an unambiguous timestamp. The intended cadence is the launch command rhythm, from hourly monitoring to a daily leadership summary. Record the scope, permitted users, owner, refresh expectation, and escalation route in one place the delivery and business teams can both inspect. The contract should be explicit about exclusions too. A clear exclusion is safer than an implied promise that every source, historical correction, or local exception will appear in the first release.
| Contract element | Question to settle | Evidence to retain |
|---|---|---|
| Decision boundary | What decision does BI dashboards for operations influence? | Named reader, operating moment, and expected action. |
| Authority | Which records are authoritative for this use? | product events, orders or requests, support contacts, fulfillment status, incident records, and launch capacity, with a domain owner and source contact. |
| Timing | When is the result safe to use? | the launch command rhythm, from hourly monitoring to a daily leadership summary, plus a visible last-successful publication time. |
| Recovery | What happens when evidence fails? | a dashboard built before event names are settled, a launch metric with no baseline, or a threshold that pages the wrong owner; triage the issue, confirm the source evidence, assign an incident or operating owner, and communicate the next review point. |
Map evidence and choose a defensible grain
Many reporting failures begin when events, snapshots, and summaries are joined before anyone states what a row means. Write the grain as a sentence: one launch event, customer journey step, order, or support case with an unambiguous timestamp. Then list the identifiers, time fields, expected arrival, correction behavior, and permitted use for each source. Preserve enough lineage to trace a published result back to the source record and transformation. Where systems use different identifiers, maintain a controlled crosswalk with an owner and review date. This work is less glamorous than dashboard design, but it is what makes a later disagreement answerable.
- Keep source identifiers and observation times when records can be corrected after arrival.
- Distinguish event time, effective time, load time, and publication time; each answers a different question.
- Document join cardinality and the expected result when a matching record is missing.
- Classify sensitive fields before making a model easy to discover.
- Treat a manual mapping as a governed dataset with change history, not as a private spreadsheet.
Define measures and controls for BI dashboards for operations
A launch dashboard is an operational instrument, not a retrospective product report. Its first job is to distinguish expected launch noise from a condition that requires a decision. Agree the signal, baseline, owner, and response while the team can still change instrumentation, runbooks, and staffing. The most useful launch view will become smaller as the operation stabilizes. For each material measure, document its business meaning, population, calculation, inclusion and exclusion rules, time window, grain, owner, and known limitation. The core signals here are activation, completion, error rate, support contact rate, backlog, fulfillment time, and incident recovery time. A threshold deserves a response path, not a color alone. Use worked examples to test whether two reasonable readers reach the same result. If a measure cannot be explained without a long technical aside, keep refining the definition before it becomes a default in an important meeting.
| Measure component | Planning question | Control that prevents misunderstanding |
|---|---|---|
| Business meaning | What condition does this describe? | A plain-language definition reviewed by the accountable reader. |
| Calculation | Which records count and which do not? | Versioned logic and a small set of worked examples. |
| Comparison | What is the reference point? | An explicit target, baseline, forecast, plan, or prior period. |
| Response | What happens outside tolerance? | triage the issue, confirm the source evidence, assign an incident or operating owner, and communicate the next review point |
Design the controlled path
Build the delivery path so an investigation can travel from reader output to source evidence without guesswork. Separate intake, transformation, reusable definitions, and the reader experience. Run checks at the point where they are cheapest to diagnose: source arrival, schema conformance, record-level validity, transformation outputs, and published totals. Treat a dashboard built before event names are settled, a launch metric with no baseline, or a threshold that pages the wrong owner as a designed operating condition rather than a rare technical exception. Decide in advance whether the system warns, suppresses a measure, holds the last approved result, or blocks release. Make the result and its freshness visible to readers.
Run a usable release and review rhythm
For BI dashboards for operations, use a pilot that exposes the actual handoff before widening scope. Put one complete decision loop into the relevant operating moment, then watch what readers do when the evidence is late, surprising, or incomplete. Operations BI Dashboard: A Launch Checklist for Day One should be judged by whether a real owner can interpret the signal and carry out the agreed response, not by whether every desired field appeared in the initial release. Keep a short log of questions, overrides, and unresolved exceptions; those are the best inputs to the next iteration.
- Confirm access with real reader roles, including the person who must resolve an exception.
- Reconcile a small, agreed sample to the authoritative records before broad release.
- Publish freshness and quality status beside the result, not in a hidden runbook.
- Capture reader questions and classify them as documentation, model, access, or workflow work.
- Schedule an owner review for thresholds, source changes, and unresolved exceptions.
A six-stage path for BI dashboards for operations
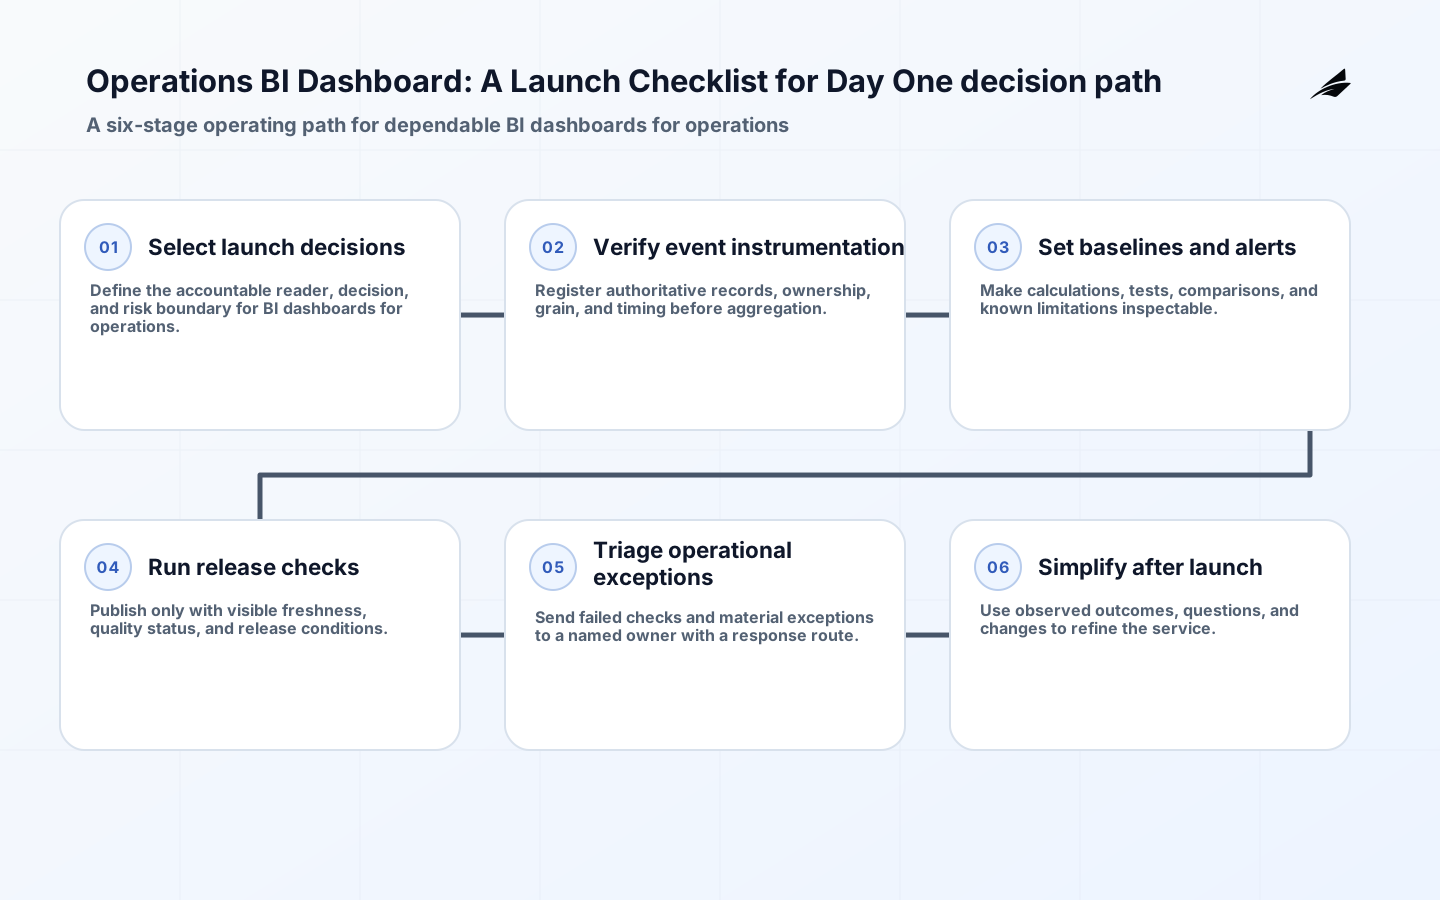
This six-stage BI dashboards for operations diagram makes the operating sequence visible. It connects the first decision to the evidence that supports it, the definitions that make it repeatable, the release conditions that keep it honest, and the exception route that turns a failed check into work for a named owner. The final stage matters: decisions, source changes, and reader behavior reveal where the service needs revision.

Key takeaways
- BI dashboards for operations should begin with a decision statement that names the reader, action, and acceptable evidence.
- A stated grain, source register, and versioned measure definition make later investigation possible.
- Freshness, quality status, and a named exception route are reader-facing requirements.
- Adoption is proven in the operating routine, not by a successful deployment alone.
- Retire or revise measures that no longer change a useful decision.
Frequently asked questions
How much should the first BI dashboards for operations release cover?
Start the first BI dashboards for operations release with the narrowest complete scope that can support a genuine decision. Include enough authoritative evidence to show the result, enough definition to interpret it, and one real response path for an exception. Resist adding adjacent data merely because it is available. A focused release makes errors visible quickly and lets the team learn which context readers truly need before expanding the service.
Who owns definitions in BI dashboards for operations?
Ownership for BI dashboards for operations is shared deliberately. The domain owner decides what a measure or model means and when it is fit for use; the data delivery owner implements, documents, and monitors that agreement. The reader who acts on the output should be able to challenge both. When interpretation changes, publish the effective date, rationale, and affected output so old and new results are never silently blended.
What should happen when a check fails?
A failed BI dashboards for operations control needs a response that is proportional to its decision risk. A missing optional attribute may remain visible with a warning, while a failure that alters a committed total or operating priority should block or clearly label publication. Readers deserve a concise status and next review time; the accountable owner needs the failing rule, affected population, and source context to correct the problem without reconstructing the incident from scratch.
Conclusion
Operations BI Dashboard: A Launch Checklist for Day One is most useful when it behaves like a dependable operating service. Define the decision, make evidence and grain explicit, document measures, test the release path, and keep exception ownership visible. That discipline gives teams a smaller but more credible starting point, and it creates a practical foundation for later automation, new sources, and broader reporting.