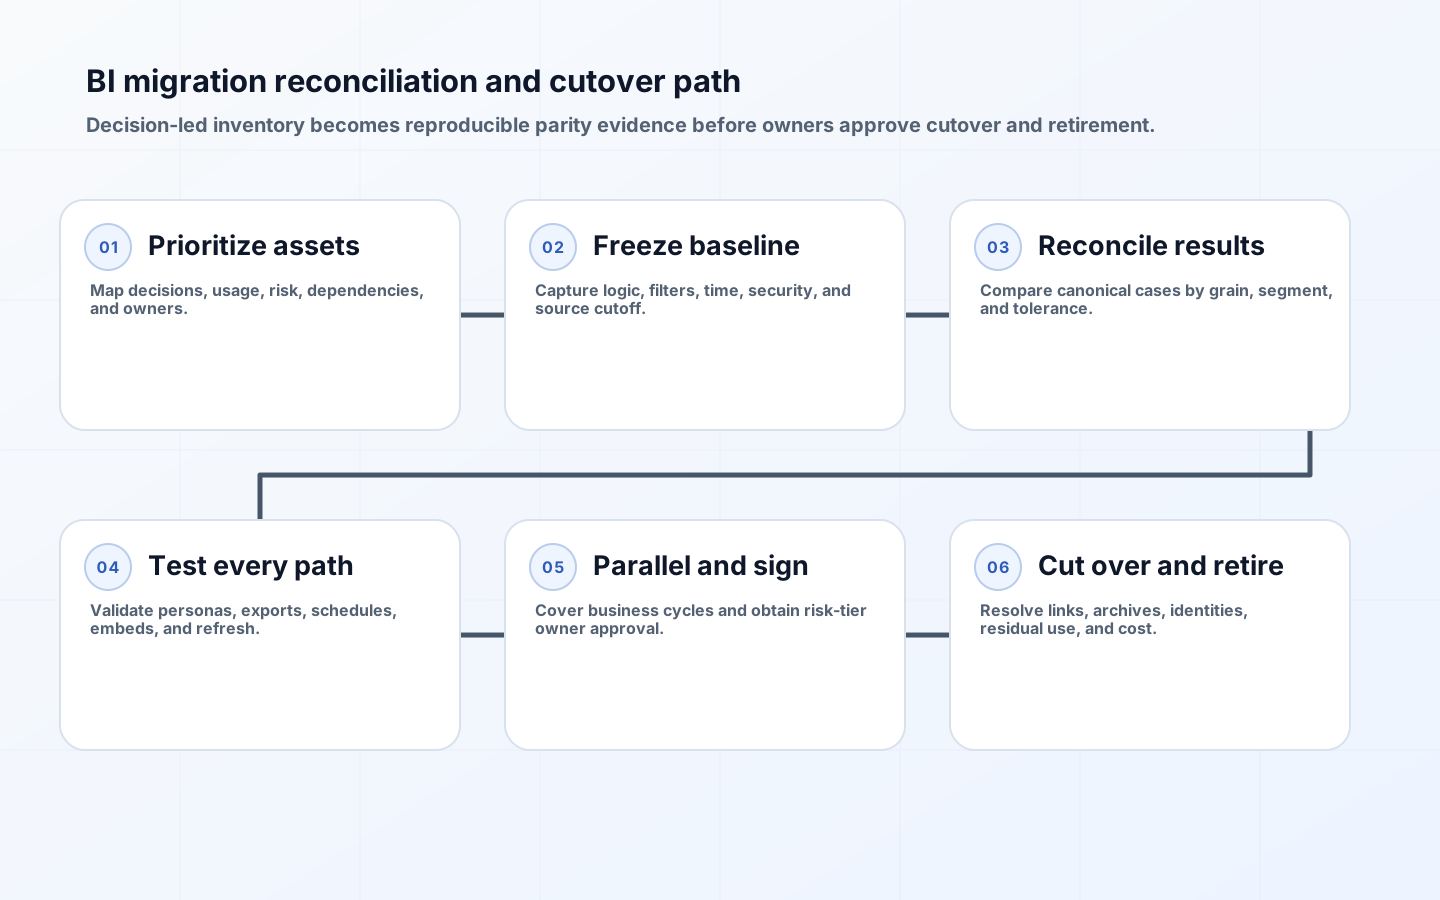
A dashboard can look identical after migration and still answer a different question. The source and target platforms may treat nulls, time zones, filter propagation, distinct counts, many-to-many relationships, row-level security, extracts, and rounding differently. BI migration validation therefore has to reconcile metric meaning and user outcomes, not only count reports or compare screenshots. Cutover is justified when priority decisions, populations, security, delivery, and operational behavior are proven in the target.
Microsoft's Power BI migration guidance includes inventory, planning, proof of concept, content creation and validation, deployment, support, and monitoring. That lifecycle is useful beyond one product, but teams need a measurable acceptance model inside it. A migration should identify what can be retired, what should be redesigned, what requires exact parity, and what intentional differences users must approve. Reproducing every legacy quirk wastes effort; silently changing material logic creates risk.
Build a usage- and decision-led inventory
Inventory dashboards, reports, workbooks, semantic models, data sources, custom SQL, extracts, refreshes, schedules, alerts, exports, embedded links, permissions, owners, and downstream files or applications. Add usage over a representative business cycle, not only the last week. Include quarterly, annual, regulatory, and incident-only content. Record the business decision and audience for each asset. An unused duplicate can be retired; a low-frequency statutory report cannot.

Group assets into migrate, consolidate, redesign, retain temporarily, or retire. Prioritize by business criticality, usage, data sensitivity, complexity, and dependency. Select canonical reports that cover major calculation and security patterns. Do not estimate effort from page count alone: one small workbook with nested calculations and extracts may be harder than many simple dashboards. Verify ownership, and escalate orphaned critical content before migration begins.
| Inventory signal | Migration action | Validation depth | Required owner |
|---|---|---|---|
| High-use critical decision | Migrate early and parallel-run | Metric, security, performance, delivery | Business and data owners |
| Duplicate of certified report | Consolidate | Consumer and filter coverage | Content owner |
| Low-use but regulated | Migrate or archive by policy | Exact output and retention | Compliance owner |
| Unused and reconstructible | Retire | Dependency and archive check | Platform owner |
| Complex unsupported feature | Redesign or temporary coexistence | Outcome-based acceptance | Product and business owners |
Freeze a semantic and data baseline
Before conversion, capture metric definitions, model relationships, default filters, calculation context, parameters, source queries, time zones, calendars, null handling, rounding, currency, row-level policies, and refresh cutoff. Export metadata through supported APIs where possible and supplement it with owner interviews. A screenshot cannot reveal hidden filters or whether a total is recalculated rather than summed. Version the baseline and record its source data snapshot.
Create canonical validation cases as tuples of metric, period, population, grain, filters, security persona, and expected result. Include total, segmented, detail, zero, null, late data, boundary dates, and high-cardinality cases. Store exact expected values for deterministic counts and acceptable numeric tolerances only where floating-point or platform differences justify them. Keep source query and cutoff evidence so a mismatch is reproducible.
Define tolerance and discrepancy rules
Classify fields and metrics. Financial totals, record counts, permissions, and regulated outputs may require exact equality. Statistical measures can allow documented absolute or relative tolerance. Timestamps may permit display differences after verified time-zone conversion. Visual ordering can differ without changing meaning, while a different top-N population is material. Do not apply one percentage tolerance to every result; it can hide a large absolute error or reject harmless precision.
Every discrepancy receives a category: source snapshot mismatch, refresh timing, intended redesign, legacy defect, target defect, platform semantic difference, formatting only, or unresolved. Intended changes require owner approval and user communication. Legacy defects should not automatically be recreated, but corrected outputs need a restatement plan. Unresolved material differences block sign-off. Track the first failing grain and segment rather than comparing totals only, because overcounts and undercounts can cancel.
| Difference | Example | Default disposition | Evidence |
|---|---|---|---|
| Exact-control failure | Different invoice count | Block | Row-level reconciliation |
| Time-zone translation | Midnight event moves date | Approve if contract matches | UTC and local examples |
| Rounding only | Last displayed decimal differs | Accept within policy | Raw values and format |
| Legacy defect corrected | Old join duplicated orders | Approve as intentional change | Owner decision and communication |
| Population shift | Hidden filter omitted | Block or version metric | Filter and cohort diff |
Automate metric and population reconciliation
Query both platforms against the same stable source snapshot when possible. Export normalized result sets through supported APIs, align column types and ordering, and compare keys, counts, values, nulls, and aggregates. Reconcile top-level totals, then descend by time, tenant, region, product, and other risk dimensions. Sample underlying rows for mismatched groups. Keep comparison code and fixtures outside vendor-specific report files so it can be rerun through cutover.
Use structural validators in addition to value comparison. Looker's Content Validator, for example, finds content references to missing models, Explores, views, and fields, while warning that broad replacements can affect content and lack an undo function. Similar platform tools can catch broken references, but they do not prove metric parity. Combine platform validation, semantic tests, result comparisons, and user workflow checks.
Validate security and delivery paths
Create personas for ordinary viewers, managers, cross-region users, external customers, report authors, support, and administrators. Compare visible content, row populations, object access, exports, drill-through, search, saved views, schedules, subscriptions, and embedded access. Verify group mapping and identity lifecycle. A report that returns the right total to an administrator can still leak rows to a viewer or deny legitimate access after group synchronization.
Test refresh, incremental load, gateway or private connectivity, credentials, alerts, email delivery, PDF or spreadsheet export, API clients, and links from applications. Inventory old URLs and content IDs before cutover. Update embedded references and automation deliberately. Validate artifact classification and retention after export. A migration is incomplete if numbers match interactively but scheduled board packs or customer portals stop working.
Run old and new platforms in parallel
Choose a period that includes ordinary operations, month or quarter boundaries, late-arriving data, a source correction, peak concurrency, and at least one scheduled delivery cycle. Refresh both platforms from aligned cutoffs and run the canonical suite repeatedly. Record discrepancies by release so fixes do not reopen approved cases. Freeze material legacy logic during the final window or route changes through both implementations.
Invite representative users to complete decisions, not simply inspect charts. Can a manager find an exception, apply the usual filters, drill to evidence, export an approved list, and explain freshness? Capture usability, latency, accessibility, and training gaps. Parallel run does not require every user to use both tools forever; focus evidence on high-risk assets and cohorts. Extend coexistence only for a named unresolved dependency with owner and end date.
Use risk-based sign-off and cutover gates
Create acceptance by asset tier. A critical report requires passed canonical cases, zero unresolved material discrepancies, security parity, refresh and delivery success, performance target, owner approval, support runbook, and rollback. Lower-risk content can use sampled reconciliation and owner confirmation. Record approver, evidence version, exceptions, and expiry. A project manager cannot accept metric meaning on behalf of finance or operations.
Cut over in cohorts. Make target content discoverable, update links, communicate intentional differences, provide support, and monitor usage and errors. Preserve a read-only legacy fallback for a bounded period when risk warrants it, but prevent new content from extending the old platform. Rollback should restore access and delivery without losing target-created data or changes. Set objective triggers such as critical mismatch, security failure, or refresh breach.
Decommission with evidence, not a calendar date
Before shutdown, confirm required users are active on the target, critical queries and deliveries succeed, links and embeds are updated, data and content archives are readable, audit and retention duties are met, credentials are removed, and contracts can end. Review legacy query and access logs for remaining use. Contact owners of residual consumers. Preserve definitions and validation evidence needed to reproduce historical reports.
Remove gateways, service accounts, schedules, extracts, network rules, and licenses in a controlled order. Watch for old platform calls after each step. Close exceptions or transfer them to an owned coexistence service with cost and expiry. Measure migration success through trusted use, discrepancy closure, decision continuity, support load, and retired cost, not only the percentage of reports copied.
Key takeaways
- Prioritize content by decision, usage, risk, dependency, and owner rather than page count.
- Freeze metric, filter, time, security, and source-cutoff semantics as a testable baseline.
- Use metric-specific tolerances and require every discrepancy to have a disposition.
- Combine automated result comparison with structural, security, delivery, and workflow tests.
- Parallel-run through meaningful business cycles and use tiered owner sign-off.
- Decommission only after residual use, archives, identities, schedules, and links are resolved.
Frequently asked questions
Must every migrated report have exact visual parity?
No. Preserve business questions, metric meaning, security, and required workflows. Redesign can improve usability, but intentional differences need acceptance criteria and communication. Exact visual copying can reproduce constraints the migration was meant to remove.
How long should a parallel BI run last?
Long enough to include the important operating cycles and edge cases for the content tier. That may be weeks for daily operations and a quarter-end for finance. Use evidence coverage rather than one fixed duration for every asset.
Should a known legacy calculation error be copied?
Usually not, but correcting it changes reported history and may affect decisions. Document the defect, quantify affected periods and users, obtain business approval, publish the new contract, and preserve the old result for audit where needed.
Conclusion
A successful BI migration moves trustworthy decisions, not files. A usage-led inventory, frozen semantic baseline, automated reconciliation, persona security tests, parallel business cycles, and accountable sign-off reveal whether the target truly preserves or intentionally improves behavior. With decommission evidence and reproducible history, teams can leave the legacy platform without leaving uncertainty about what their metrics mean.