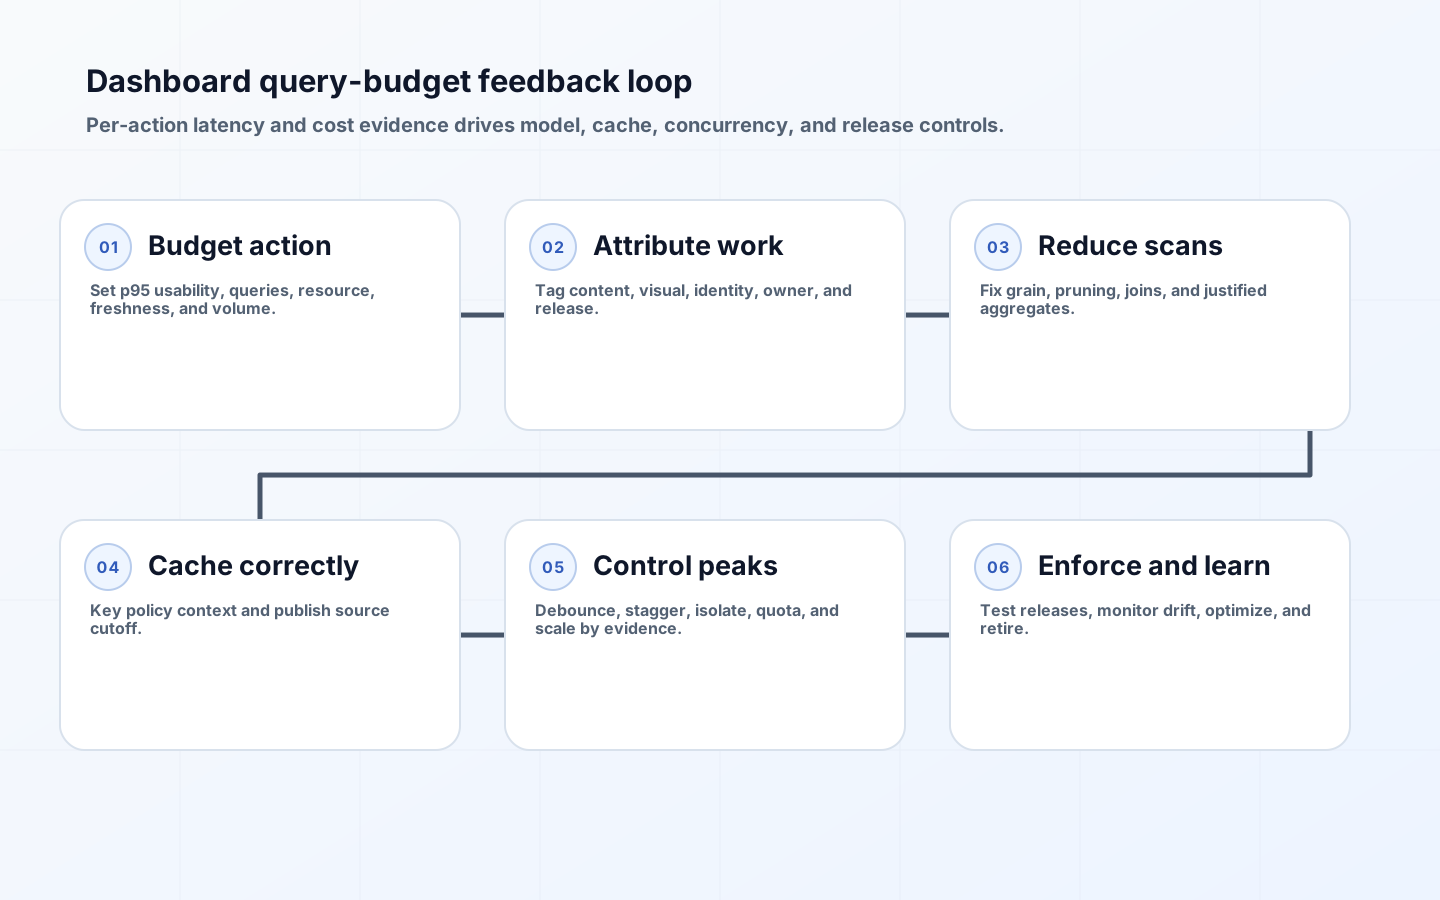
A dashboard can be fast in a design review and expensive in production. Ten visuals may issue several queries each; filters can invalidate caches; scheduled refreshes can overlap with interactive use; and a popular landing page can multiply a modest query by thousands of sessions. Dashboard query cost optimization works best when the team sets a budget before release, measures the whole user interaction, and assigns an owner for regressions. Optimizing isolated SQL after the warehouse bill arrives is a late control.
A budget joins performance and economics. It defines acceptable load time, interaction time, query count, data scanned or compute consumed, concurrency, freshness, and monthly or per-view cost for a named audience. The values should come from the decision and platform model. BigQuery offers maximum-bytes-billed controls for on-demand queries and capacity reservations for other workloads; Snowflake separates query performance concerns such as queueing, memory spill, warehouse size, cache, and concurrency; Power BI performance depends on source, semantic model, visual, capacity, gateway, and network layers. No one threshold transfers unchanged across them.
Budget the user action, not one SQL statement
Define the page or action: initial executive overview, tenant drill-down, date-filter change, export, mobile load, or embedded customer view. Capture every query and background request it causes, including metadata, totals, tooltips, hidden visuals, row-level security lookups, and refresh checks. Measure browser render and network time separately from warehouse execution. A query can finish quickly while sequential visuals keep the page unusable.
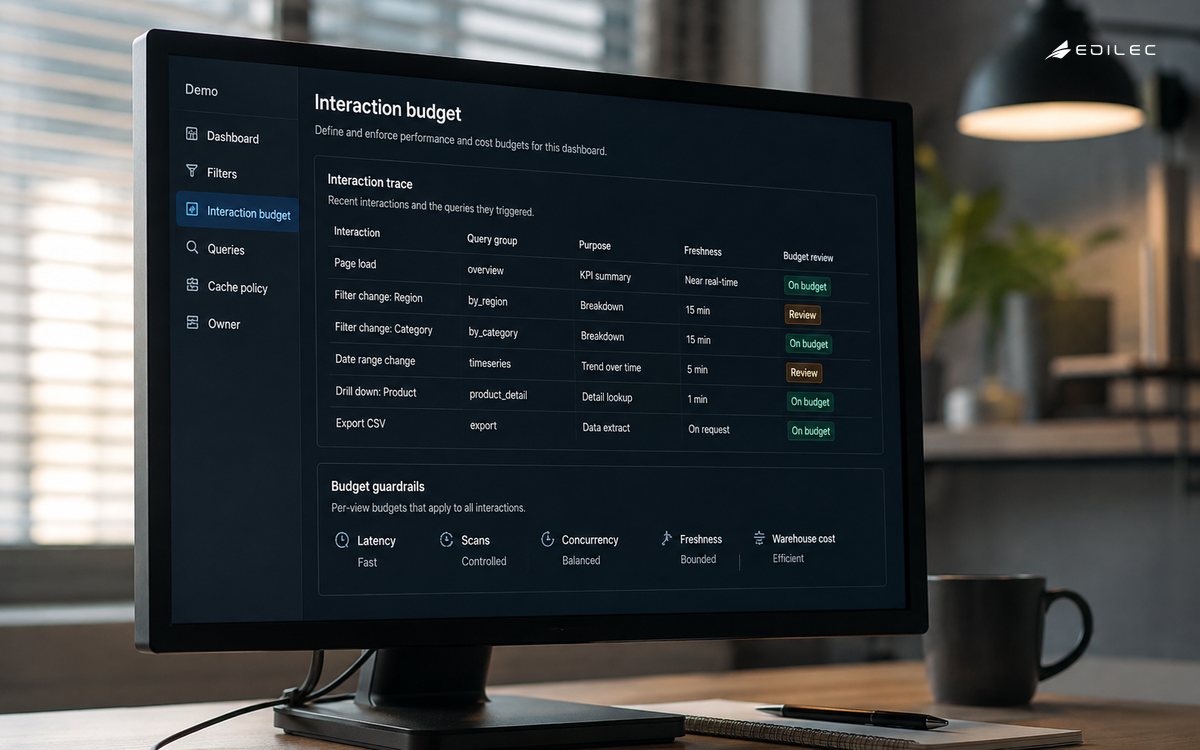
Set p50 and tail targets for a representative geography, device, and cache state. Include cold and warm paths. Specify maximum queries per action, scan or compute units, queued time, and error rate. For recurring pages, estimate sessions, filter interactions, refresh frequency, and peak concurrency. A per-view budget that ignores volume cannot control the monthly bill; a monthly budget without per-action diagnostics cannot guide engineers.
| Budget dimension | Example unit | Why it matters | Measurement boundary |
|---|---|---|---|
| Initial usability | p95 seconds | Users abandon or mistrust slow pages | Navigation to usable primary decision |
| Query fan-out | Queries per page action | Visuals multiply warehouse work | All requests caused by one interaction |
| Data processed | Bytes, partitions, or credits | Consumption drives cost | Warehouse jobs tagged to content |
| Concurrency | Peak active queries | Queues degrade shared workloads | Content and workload pool |
| Freshness | Source cutoff age | Cache savings trade against decision value | Data generation to visible result |
Attribute every query to content and owner
Tag queries with dashboard, page, visual, semantic model, environment, user class, and release where the tools permit it. Maintain a mapping when generated SQL cannot carry tags. Combine BI usage logs with warehouse query history. Group parameterized queries by stable hash or normalized shape to find frequently repeated patterns. Snowflake documents query history and hashes for performance analysis; other warehouses provide analogous job metadata.
Allocate shared warehouse cost carefully. Direct query cost may be visible under on-demand billing, while provisioned capacity is shaped by elapsed active time, autoscaling, queues, and other workloads. Report both marginal work and allocated capacity. Avoid fake precision: a dashboard can be a major concurrency driver without owning every credit in the hour. The owner should see trend, peak contribution, cache rate, and top query shapes, not only one disputed currency total.
Reduce work at the semantic and storage layers
Start with the data model. Use the correct grain, selective columns, partition pruning, clustering where supported, and joins that do not multiply rows. BigQuery notes that LIMIT on a non-clustered table does not reduce data read, while maximum bytes billed can reject an estimated over-budget query. Do not confuse fewer returned rows with less scanned data. Materialize expensive reusable stages when storage and refresh cost are lower than repeated computation.
Pre-aggregate at the dashboard's common grain, but preserve drill paths and reconciliation to detail. A daily account summary may serve an executive page far better than joining events for every view. Keep metric definitions centralized so performance copies do not diverge. Measure write amplification and refresh time: an aggregate used twice a month may cost more to maintain than the queries it replaces. Remove unused fields and high-cardinality dimensions that make every filter expensive.
| Optimization | Best fit | Hidden cost | Proof required |
|---|---|---|---|
| Result cache | Repeated equivalent queries | Stale data or security leakage | Hit rate, identity key, freshness |
| Pre-aggregation | Stable common grains | Refresh and storage | Query savings exceed maintenance |
| Partition or cluster pruning | Selective predictable filters | Write and layout maintenance | Scanned data reduction |
| Import or extract | Bounded analytical model | Refresh delay and duplication | Freshness meets decision need |
| Larger compute | Parallel or spill-bound workload | Higher burn rate | Tail latency improves economically |
Make caching a freshness contract
Cache keys must include metric version, filters, row-level security context, locale or time zone when results differ, and source version. A cache shared across tenants without equivalent policy is a data breach. Define time-to-live from the decision deadline, not an arbitrary hour. Invalidate on source publication or semantic release when practical. Return generated time and source cutoff so users can distinguish a cached response from current underlying data.
Use layered caches deliberately: browser, BI result, semantic layer, warehouse result, and aggregate table. More layers can increase hit rate but make invalidation and diagnosis harder. Power BI notes that dashboard tile caching behavior differs for live report and streaming tiles and that dynamic row-level security can affect cache behavior. Test the exact visual and security mode. A cache assumption from one report type should not become platform policy.
Control concurrency and isolate workloads
Stagger scheduled refreshes and subscriptions, cancel superseded filter queries, debounce rapid interactions, and limit parallel visuals. Separate critical customer or executive workloads from exploratory queries when one pool creates mutual interference. Snowflake recommends considering queue reduction, memory spill, warehouse size, cache, and concurrent-query limits. Increasing compute may help, but first determine whether the page issues unnecessary or duplicate work.
Set hard controls with care. BigQuery maximum bytes billed can fail an over-limit on-demand query before charge, but estimated bytes for clustered tables can be an upper bound. Snowflake resource monitors can notify or suspend warehouses based on credit use, yet documentation notes that they do not control every serverless service and a running query may complete after a suspend threshold. Use platform limits as backstops, not substitutes for content budgets and ownership.
Enforce budgets before and after release
Create representative performance fixtures and run pages with cold and warm caches, standard and restricted identities, ordinary and wide date ranges, and desktop and mobile layouts. Fail a release for query-count explosion, broken partition filters, unbounded date defaults, or a major regression against the approved budget. Use controlled test data for stable comparisons, then canary in production because optimizers, concurrency, and real cardinality differ.
Monitor p95 page and query latency, queue time, scan or credits, cache hit rate, errors, freshness, sessions, and cost per successful view. Compare by release and content owner. Alert on sustained change rather than one cold query. Provide an optimization queue ordered by total avoidable cost and user impact. Retire unused dashboards and schedules; an abandoned report can keep refreshing long after interactive use stops.
Make freshness and flexibility tradeoffs explicit
The cheapest query is the one not run, but a frozen dashboard can be useless. Offer curated fast paths for common decisions and a clearly priced exploratory path for advanced users. Narrow default date ranges while allowing deliberate expansion. Refresh high-value operational tiles more often than descriptive history. Avoid disabling exports or filters merely to pass a budget when the workflow needs them; redesign the serving model or fund the required capacity.
A performance budget is a decision aid, not a universal veto. A regulatory report may justify costly completeness. A customer-facing page may justify reserved capacity for predictable latency. Record the exception, owner, economic reason, and review date. Budgets become useful when they force an explicit choice among freshness, flexibility, latency, and cost before popularity turns an unnoticed query pattern into a permanent expense.
Key takeaways
- Set budgets for complete user actions, including fan-out, render, concurrency, and volume.
- Tag warehouse work to dashboard, page, visual, security class, and release.
- Reduce scanned and repeated work through model design, pruning, and justified pre-aggregation.
- Treat cache identity and freshness as correctness and security contracts.
- Use warehouse quotas and monitors as backstops with documented limitations.
- Test budgets in CI and production, then retire unused content and schedules.
Frequently asked questions
What is a good query budget?
There is no universal number. Derive it from the user decision, audience volume, warehouse pricing and capacity, freshness need, and current baseline. Set latency, query-count, resource, and monthly limits together so one measure cannot be optimized by shifting cost elsewhere.
Should every dashboard use caching?
Cache when equivalent requests repeat and the freshness and security contract permits reuse. Do not cache across unequal tenant or row-security contexts, and expose source cutoff. Highly personalized or rapidly changing queries may benefit more from aggregates and workload isolation.
Why not just scale the warehouse?
Scaling can reduce queues, spill, or execution time, but it can also make duplicate work more expensive and may not improve sequential visual fan-out or network rendering. Profile the bottleneck and compare saved user time with added capacity cost.
Conclusion
Dashboard performance and warehouse cost are two views of the same consumption system. Per-action budgets, reliable attribution, efficient models, secure caching, concurrency controls, and release evidence let teams manage that system before scale magnifies waste. The result is not merely a cheaper dashboard. It is a predictable decision surface whose freshness, responsiveness, and economic footprint have accountable owners.