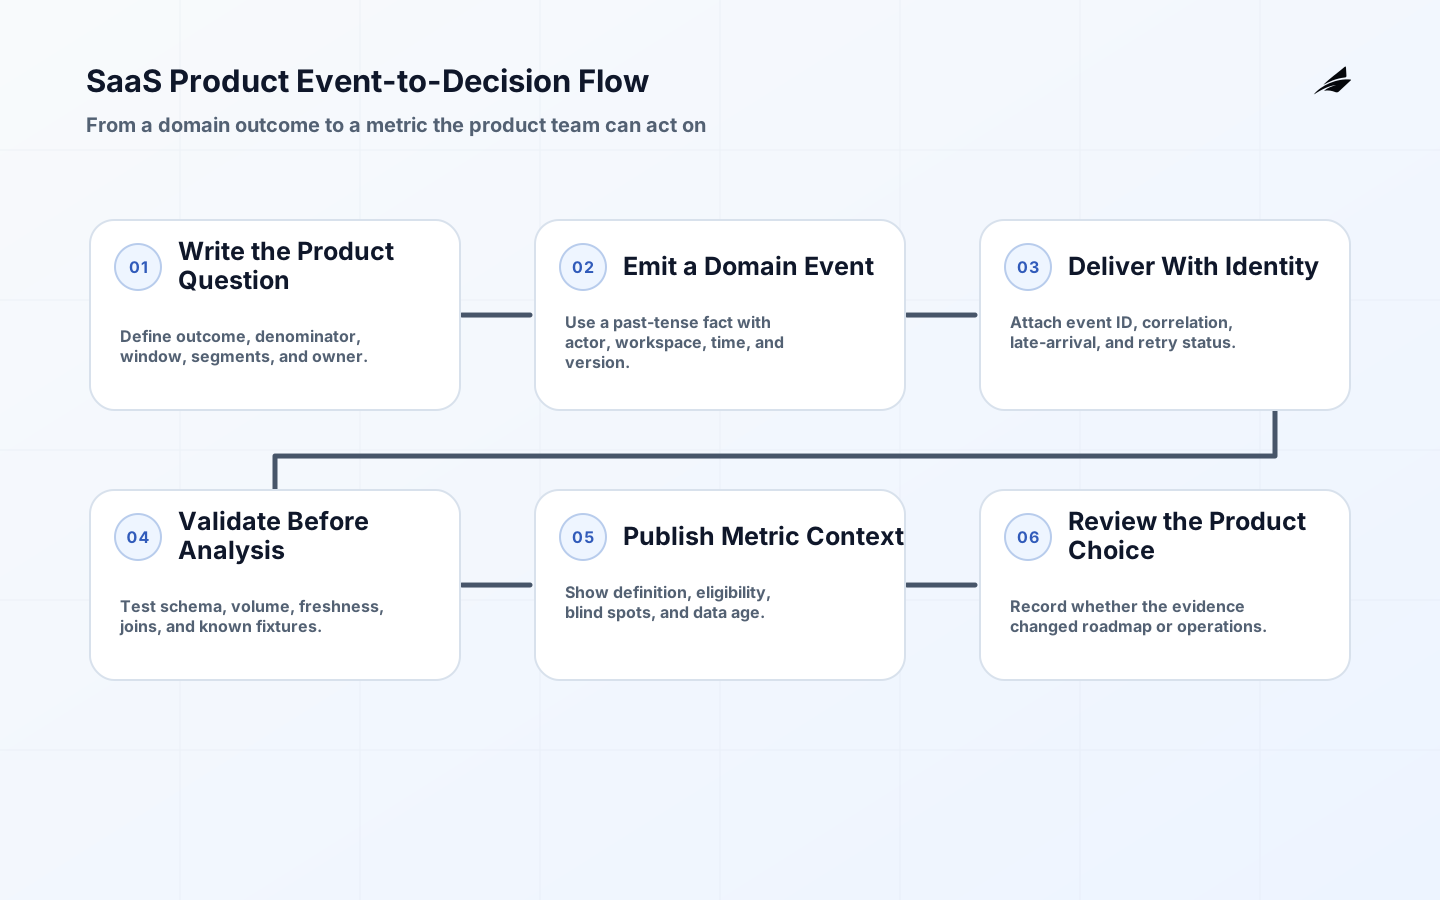
Product analytics is useful when it reduces a real decision's uncertainty. It is not a contest to capture every click or fill a dashboard with counters. A team needs to know whether a customer reached a meaningful outcome, where a workflow creates friction, whether a release changed behavior, or which account needs help. Events, identities, definitions, retention, and access controls should be designed around those decisions before instrumentation begins.
Why Product Analytics Matters
Analytics fails quietly when event names survive product changes but their meaning does not. A metric labelled 'activated' may refer to a button click, an import completion, or a user who reached first value; each interpretation leads to a different investment. The remedy is a small, versioned event contract that states the action, actor type, workspace context, business meaning, owner, and expected properties. It gives analysts and engineers a shared reference when numbers look surprising.
Start with questions rather than a tracking-plan spreadsheet. For onboarding, the question might be, 'Do newly invited administrators create a first project without support?' For a reliability change, it might be, 'Did background jobs complete more consistently for affected workspaces?' Define the outcome, denominator, time window, and important segments. Then collect the minimum event evidence needed to answer it. This approach limits privacy exposure and makes data quality review practical.
Start With a Decision
Write event names as past-tense domain facts, not screen mechanics. project_created is usually more durable than create_button_clicked, because it says the server accepted an outcome. Where client-side interaction is needed to explain abandonment, pair it with the server-side result and document their relation. Include an event schema version when semantics can change. Do not silently reuse a property for a new meaning; a clean break is less costly than a misleading historical trend.

| Field | Why it exists | Example constraint |
|---|---|---|
| Event name | Names the domain outcome. | Use a stable past-tense verb and noun. |
| Occurred time | Orders behavior and supports windows. | Use producer time with ingestion time for diagnosis. |
| Workspace scope | Supports B2B analysis and isolation. | Use a pseudonymous stable ID, not a display name. |
| Schema version | Preserves interpretation after changes. | Increment when a field's meaning changes. |
Separate product analytics identities carefully. A person may belong to several workspaces, so user-level behavior and account-level adoption are different questions. Store the minimum identifiers needed to join approved data, document who can access them, and avoid copying sensitive text into event properties. A free-form search query, uploaded filename, or support note can easily become an unintended collection of personal or confidential information. Privacy review belongs in the event-design step, not after a dashboard is popular.
Build a Reliable Pipeline
Instrument the path with resilience in mind. Client events can be lost when a page closes or an ad blocker intervenes, while server events can fail when a queue or downstream warehouse is unavailable. Capture delivery status, late arrival, duplicate rate, and schema rejection. Use an event ID or a deterministic idempotency key for at-least-once delivery. A pipeline should make loss visible rather than quietly producing a thinner chart.
Keep operational telemetry and product analytics connected but distinct. Traces and logs explain why a request was slow or failed; product events explain whether the user completed a goal. Shared correlation IDs can connect an incident to product impact without making an analytics warehouse a general log archive. Establish access rules, retention periods, and redaction practices for both. The person on call needs enough context to diagnose failures without receiving an unrestricted feed of customer content.
Validate Before Interpretation
Treat data quality as a release criterion. Automated checks can verify required properties, accepted enum values, timestamp ranges, event volume, and schema compatibility. A staging or pilot workspace can generate expected fixtures that a test asserts at the collector and warehouse. When an event changes, update the event contract, dashboards, and analyst notes in the same change. Otherwise a successful deploy can still corrupt the decision layer.
| Quality check | Detects | Response |
|---|---|---|
| Schema validation | Malformed or unexpected properties. | Reject, quarantine, and alert the owning team. |
| Volume comparison | Dropped instrumentation or duplicate sends. | Compare with request or domain-record counts. |
| Freshness check | Delayed pipeline or query failure. | Show data age and investigate the stalled stage. |
| Segment sanity test | Incorrect workspace or identity join. | Use known fixtures and inspect boundary cases. |
Interpret trends with operational context. A decline in completions could be a product regression, a tracking failure, a changed eligibility rule, a holiday, or one large customer's rollout. Show the metric definition, data freshness, population, and known changes beside the chart. Before acting on a surprising result, sample raw eligible records or reconstruct a few customer journeys. This habit prevents a confident dashboard from steering a team toward the wrong fix.
Operate a Trusted System
Assign owners for high-value metrics and review them at a regular cadence with the team that can act. Track instrumentation coverage, schema rejects, event lag, metric freshness, dashboard access, and unanswered decisions. Remove events that no longer inform a decision; lower collection is often a quality improvement. When a metric repeatedly generates debate, improve its definition or retire it rather than treating disagreement as a reporting problem.
Example: First Value for an Administrator
A team wants to improve first value for new workspace administrators. It defines success as creating a project and inviting one teammate within seven days of acceptance, then emits server-side project_created and member_invited events with workspace-safe IDs and schema versions. A client event records when the invite form displays an error. The dashboard shows eligibility, completion, median time, and data freshness. Support reviews a small sample of non-completers before the team changes the flow.
The product analytics for SaaS guide is a useful companion when you need to decide who owns the decision system. The practical test is whether a person unfamiliar with the chart can find the definition, verify its freshness, and identify the next action it was designed to inform.
Review Metric Decisions
A metric review should start with the decision it was meant to support and end with whether the team acted differently because of it. For each important measure, record the owner, definition, source tables or event contract, update cadence, known blind spots, and review meeting. When the metric shifts, annotate releases, eligibility changes, outages, migrations, and campaigns that could explain it. That record helps future team members distinguish a real change in customer behavior from a change in collection or population.
Retain a small set of fixture journeys as the product evolves. A test workspace can create a known event sequence for signup, invitation, first outcome, failed action, retry, and cancellation. Automated checks then verify that events still arrive and aggregate as expected. This is more durable than manually inspecting a dashboard after each release. It also gives analysts a shared way to ask whether an apparent regression reflects customer behavior or a broken link in the analytics pipeline.
Establish a change protocol for events that feed important reports. The product owner proposes the semantic change, engineering updates the producer and schema, data owners identify affected measures, and reviewers decide whether to backfill, begin a new series, or annotate the break. This prevents a small interface refactor from silently changing a board metric or a customer-health score. It also makes historical analysis more honest: older values remain meaningful within their documented definition instead of being compared to a different population.
Give dashboard readers a route back to evidence. A high-level trend should link to the metric definition, freshness status, segment logic, and a safe drill-down for authorized operators. Avoid dashboards that imply precision beyond their data quality. For example, a funnel based on client events may be excellent for identifying broad friction but unsuitable for a customer-level service commitment. Naming that boundary builds trust and helps leaders choose the right next investigation instead of turning every chart into an unexamined scorecard.
Establish a careful access model for analytics workspaces as well. Product managers may need aggregated trends, support teams may need a tenant-scoped diagnostic view, and data engineers may need restricted raw-event access to repair a pipeline. Give each group only the appropriate granularity and log exports from sensitive environments. A dashboard tool is still part of the system's data surface. Its convenience should not turn a well-designed event contract into a broadly accessible customer-behavior archive.
When a metric is retired, remove its scheduled reports and explain the replacement to regular readers. Leaving obsolete measures visible invites accidental comparison and distracts teams from the decisions that matter now.
Key Takeaways
- Instrument decisions and outcomes, not every interface movement.
- Use versioned event contracts with explicit workspace and identity semantics.
- Make schema, volume, freshness, and segment checks routine.
- Pair metrics with definitions, privacy controls, and an accountable action owner.
Frequently Asked Questions
Should analytics events be sent from the browser or server? Use server events for accepted business outcomes and client events for interaction context that the server cannot observe. Document how they relate. How many metrics should a product team track? Start with the few that drive active decisions. A smaller set with clear definitions and dependable collection is more valuable than a large unread dashboard.
Conclusion
Product analytics becomes trustworthy when it is designed as a governed decision system. Clear events, bounded collection, reliable delivery, transparent quality checks, and human review turn behavioral data into evidence that product and operations teams can safely use.
Sources
For current implementation and governance references, consult OpenTelemetry, the NIST Privacy Framework, the OWASP ASVS, and the Google SRE Workbook on monitoring.